danielboon
TB Fanatic
BREAKING NEWS Massachusetts coronavirus cases: 6,304 deaths, 91,662 positive tests Massachusetts coronavirus cases: 6,304 deaths, 91,662 positive tests 76 new deaths down from yesterday

Problem: All the money/effort is going into vaccines. I think if 1/10 of that went into treatment, particularly a prophylactic pill that the people trusted we'd be home free. (Metaphor there)How do you spell relief? H-C-Q-A-Z-Zn
Problem: All the money/effort is going into vaccines. I think if 1/10 of that went into treatment, particularly a prophylactic pill that the people trusted we'd be home free.
 www.health.pa.gov
| Total Cases* | Deaths | Negative** | Recovered*** |
| 66,983 | 5,096 | 321,469 | 59% |
| Confirmed Cases | Probable Case by Definition and High-Risk Exposure | Probable Case by Serology Test and Either Symptoms or High-Risk Exposure |
| 65,209 | 1,774 | 513 |
| Age Range | Percent of Cases* |
| 0-4 | < 1% |
| 5-12 | < 1% |
| 13-18 | 2% |
| 19-24 | 6% |
| 25-49 | 37% |
| 50-64 | 25% |
| 65+ | 29% |
| Age Range | Percent of Cases* |
| 0-4 | < 1% |
| 5-12 | < 1% |
| 13-18 | < 1% |
| 19-24 | 1% |
| 25-49 | 16% |
| 50-64 | 26% |
| 65+ | 57% |
| County | Total Cases | Negatives |
| Adams | 222 | 2659 |
| Allegheny | 1753 | 26185 |
| Armstrong | 58 | 1112 |
| Beaver | 552 | 3220 |
| Bedford | 37 | 629 |
| Berks | 3845 | 10034 |
| Blair | 46 | 2349 |
| Bradford | 44 | 1308 |
| Bucks | 4839 | 16573 |
| Butler | 216 | 3371 |
| Cambria | 56 | 3118 |
| Cameron | 2 | 116 |
| Carbon | 227 | 1989 |
| Centre | 143 | 1836 |
| Chester | 2364 | 10110 |
| Clarion | 28 | 636 |
| Clearfield | 34 | 926 |
| Clinton | 49 | 505 |
| Columbia | 342 | 1164 |
| Crawford | 21 | 975 |
| Cumberland | 584 | 3994 |
| Dauphin | 1061 | 8682 |
| Delaware | 6114 | 17460 |
| Elk | 6 | 281 |
| Erie | 210 | 3797 |
| Fayette | 94 | 2863 |
| Forest | 7 | 64 |
| Franklin | 711 | 4523 |
| Fulton | 14 | 188 |
| Greene | 27 | 694 |
| Huntingdon | 227 | 742 |
| Indiana | 89 | 1128 |
| Jefferson | 7 | 465 |
| Juniata | 94 | 301 |
| Lackawanna | 1476 | 5235 |
| Lancaster | 2790 | 13677 |
| Lawrence | 74 | 1138 |
| Lebanon | 900 | 4031 |
| Lehigh | 3628 | 12459 |
| Luzerne | 2631 | 9495 |
| Lycoming | 158 | 1976 |
| McKean | 11 | 478 |
| Mercer | 103 | 1327 |
| Mifflin | 57 | 1094 |
| Monroe | 1302 | 5031 |
| Montgomery | 6464 | 29993 |
| Montour | 50 | 3117 |
| Northampton | 2866 | 11585 |
| Northumberland | 164 | 1235 |
| Perry | 45 | 597 |
| Philadelphia | 17208 | 49347 |
| Pike | 476 | 1839 |
| Potter | 4 | 131 |
| Schuylkill | 576 | 3973 |
| Snyder | 38 | 356 |
| Somerset | 37 | 1480 |
| Sullivan | 2 | 82 |
| Susquehanna | 95 | 628 |
| Tioga | 16 | 486 |
| Union | 52 | 958 |
| Venango | 8 | 453 |
| Warren | 3 | 323 |
| Washington | 135 | 3777 |
| Wayne | 117 | 851 |
| Westmoreland | 437 | 8131 |
| Wyoming | 33 | 392 |
| York | 904 | 11797 |
| Sex | Positive Cases | Percent of Cases* |
| Female | 36,823 | 55% |
| Male | 29,472 | 44% |
| Neither | 3 | 0% |
| Not reported | 685 | 1% |
| Race | Positive Cases | Percent of Cases** |
| African American/Black | 8061 | 12% |
| Asian | 909 | 1% |
| White | 17,864 | 27% |
| Other | 376 | 1% |
| Not reported | 39,773 | 59% |
| Region | Positive | Negative | Inconclusive |
| Northcentral | 997 | 13154 | 17 |
| Northeast | 12563 | 49504 | 140 |
| Northwest | 433 | 10979 | 18 |
| Southcentral | 4730 | 41586 | 75 |
| Southeast | 43239 | 151167 | 899 |
| Southwest | 3247 | 55079 | 44 |

Most of these are close to 50%!The long-term care numbers leave me a bit shocked. I went through the article I posted a bit upstream and compared their deaths to the total county deaths. In Hendricks Co, I've never seen one public comment about the LTC deaths.
The first number is LTC deaths, the county, the county total deaths.
32 Allen = 65
1 Bartholomew = 33
33 Boone = 35
3 Clark = 38
15 Daviess = 16
9 Decatur = 31
15 Delaware = 26
16 Elkhart = 27
10 Floyd = 38
7 Grant = 20
19 Green = 22
55 Hamilton = 91
16 Hancock = 27
45 Hendricks = 63
2 Henry = 5
6 Howard = 17
83 Johnson = 102
1 Kosciusko = 1
18 Lawrence = 21
11 Lake = 166
41 Madison = 57
116 Marion = 528
14 Montgomery = 14
11 Morgan = 22
10 Noble = 20
1 Porter = 19
12 Shelby = 21
22 Warrick = 26
1 Wayne = 5
7 White = 8

Will you get Monday off for a little R&R?Most of these are close to 50%!
Thanks for posting. I’ve been working so much and too tired to find it myself. I’ve previously been looking almost daily, for new information for Indiana but just too tired this week.

 ktvl.com

 www.npr.org


And remember to tell the guys to raise and lower the seat.

 www.breitbart.com
 www.breitbart.com

 www.breitbart.com

In California and many other states, medical visits governors decided are of a “nonemergency” variety have included routine mammograms, breast ultrasounds, and colonoscopies – which often detect cancers at their earliest stages, when they are most treatable.What I’m concerned about right now, not just for lung cancer but for all cancers, is are there patients out there that don’t want to come in because they’re afraid of getting COVID-19? And, so, they avoid mammograms, they avoid cat scans, they avoid colonoscopies … Then in two years we’re hit with this massive wave of patients that are all at a later stage of essentially incurable cancers.
Additional data published Friday by global public health experts warned millions of children under a year old could be at risk for diseases such as diphtheria and polio due to the delay of their routine immunization visits to pediatricians and family practice physicians during the pandemic.Our patients have suffered needlessly in pain and physical decline with disease progression because of short-sighted government edicts to stop all non-emergency care that is unrelated to COVID19. Some patients now face inevitable death because the diagnosis and treatments were delayed too long. Too many of our patients have suffered far more from the psychological, physical, and economic effects of the shutdown of communities and businesses than the direct impact of COVID 19 itself.
 news.trust.org

 www.sandiegouniontribune.com

 www.breitbart.com

 www.breitbart.com


At best, lockdowns push cases into the future, they do not lower total deaths. Gieseck continues:It has become clear that a hard lockdown does not protect old and frail people living in care homes—a population the lockdown was designed to protect. Neither does it decrease mortality from COVID-19, which is evident when comparing the UK's experience with that of other European countries.
As a public policy measure, the lack of evidence that lockdowns work must be balanced with the fact that we have already observed that economic destruction is costly in terms of human life.Measures to flatten the curve might have an effect, but a lockdown only pushes the severe cases into the future—it will not prevent them. Admittedly, countries have managed to slow down spread so as not to overburden health-care systems, and, yes, effective drugs that save lives might soon be developed, but this pandemic is swift, and those drugs have to be developed, tested, and marketed quickly. Much hope is put in vaccines, but they will take time, and with the unclear protective immunological response to infection, it is not certain that vaccines will be very effective.
The question the model set out to ask was whether lockdown states experience fewer Covid-19 cases and deaths than social-distancing states, adjusted for all of the above variables. The answer? No. The impact of state-response strategy on both my cases and deaths measures was utterly insignificant. The "p-value" for the variable representing strategy was 0.94 when it was regressed against the deaths metric, which means there is a 94 per cent chance that any relationship between the different measures and Covid-19 deaths was the result of pure random chance.
Another study on lockdowns—again, we're talking about forced business closures and stay-at-home orders here—is this study by researcher Lyman Stone at the American Enterprise Institute. Stone notes that areas where lockdowns were imposed either had already experienced a downward trend in deaths before the lockdown could have possibly shown effects or showed the same trend as the year prior. In other words, lockdown advocates have been taking credit for trends that had already been observed before lockdowns were forced on the population.Overall, however, the fact that good-sized regions from Utah to Sweden to much of East Asia have avoided harsh lockdowns without being overrun by Covid-19 is notable.
Experience increasingly suggests that a more targeted approach is better for those who actually want to limit the spread of disease among the most vulnerable. The overwhelming majority—nearly 75 percent—of deaths from COVID-19 occur in patients over sixty-five years of age. Of those, approximately 90 percent have other underlying conditions. Thus, limiting the spread of COVID-19 is most critical among those who are already engaged with the healthcare system and are elderly. In the US and Europe, more than half of COVID-19 deaths are occuring in nursing homes and similar institutions.Here’s the thing: there’s no evidence of lockdowns working. If strict lockdowns actually saved lives, I would be all for them, even if they had large economic costs. But the scientific and medical case for strict lockdowns is paper-thin.
Yet it is not obvious why testing would make a difference, especially to the death rate. Testing does not cure the disease. Germany’s strange achievement of a consistently low case fatality rate seems baffling—until you think through where most early cases were found: in hospitals. By doing a lot more testing, countries like Germany might have partly kept the virus from spreading within the healthcare system. Germany, Japan and Hong Kong had different and more effective protocols in place from day one to prevent the virus spreading within care homes and hospitals.
We could contrast this with the policies of Governor Andrew Cuomo in New York, who mandated that nursing homes accept new residents without testing. This method nearly ensures that the disease will spread quickly among those who are most likely to die from it.The horrible truth is that it now looks like in many of the early cases, the disease was probably caught in hospitals and doctors’ surgeries. That is where the virus kept returning, in the lungs of sick people, and that is where the next person often caught it, including plenty of healthcare workers. Many of these may not have realised they had it, or thought they had a mild cold. They then gave it to yet more elderly patients who were in hospital for other reasons, some of whom were sent back to care homes when the National Health Service made space on the wards for the expected wave of coronavirus patients.
With economic output crashing worldwide and unemployment soaring to Great Depression levels, governments are already looking for a way out. Don't expect to hear any mea culpas from politicians, but we can already see how governments are quickly moving toward a voluntary social-distancing, nonlockdown strategy. This comes even after politicians and disease "experts" have been insisting that lockdowns must be imposed indefinitely until there's a vaccine.At this point, the question I usually get is, "What’s your evidence that lockdowns don’t work?"
It’s a strange question. Why should I have to prove that lockdownsdon’t work? The burden of proof is to show that they do work! If you’re going to essentially cancel the civil liberties of the entire population for a few weeks, you should probably have evidence that the strategy will work. And there, lockdown advocates fail miserably, because they simply don’t have evidence.
As the pain of national lockdowns grows intolerable and countries realize that managing—rather than defeating—the pandemic is the only realistic option, more and more of them will begin to open up. Smart social distancing to keep health-care systems from being overwhelmed, improved therapies for the afflicted, and better protections for at-risk groups can help reduce the human toll. But at the end of the day, increased—and ultimately, herd—immunity may be the only viable defense against the disease, so long as vulnerable groups are protected along the way. Whatever marks Sweden deserves for managing the pandemic, other nations are beginning to see that it is ahead of the curve.

 www.sciencetimes.com

 www.npr.org
PA has done several revisions of the daily reporting format in the past week and I am beginning to think that masking just such realities about LTC is the reason. You now have to go to three separate links to figure out that close to 80% ( guessing here) of deaths in my county come from LTCs.The long-term care numbers leave me a bit shocked. I went through the article I posted a bit upstream and compared their deaths to the total county deaths. In Hendricks Co, I've never seen one public comment about the LTC deaths.
The first number is LTC deaths, the county, the county total deaths.
32 Allen = 65
1 Bartholomew = 33
33 Boone = 35
3 Clark = 38
15 Daviess = 16
9 Decatur = 31
15 Delaware = 26
16 Elkhart = 27
10 Floyd = 38
7 Grant = 20
19 Green = 22
55 Hamilton = 91
16 Hancock = 27
45 Hendricks = 63
2 Henry = 5
6 Howard = 17
83 Johnson = 102
1 Kosciusko = 1
18 Lawrence = 21
11 Lake = 166
41 Madison = 57
116 Marion = 528
14 Montgomery = 14
11 Morgan = 22
10 Noble = 20
1 Porter = 19
12 Shelby = 21
22 Warrick = 26
1 Wayne = 5
7 White = 8
Yep! That’s my usual day off anyway but yeah, today and tomorrow off (closed on Sunday)....Will you get Monday off for a little R&R?
 ..
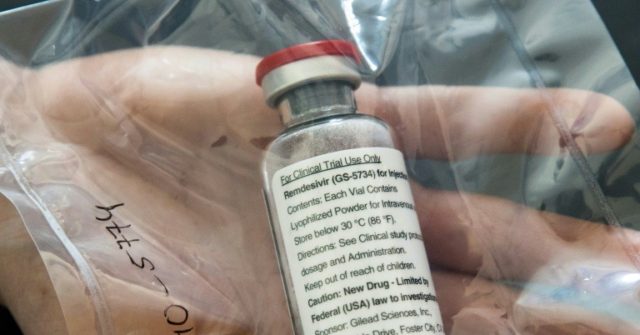
..Anti-viral drug effective against coronavirus, study finds - Breitbart
Washington (AFP) - Anti-viral drug remdesivir cuts recovery times in coronavirus patients, according to the full results of a trial published Friday
Anti-viral drug effective against coronavirus, study finds
AFP23 May 202059
Washington (AFP) – Anti-viral drug remdesivir cuts recovery times in coronavirus patients, according to the full results of a trial published Friday night, three weeks after America’s top infectious diseases expert said the study showed the medication has “clear-cut” benefits.
Complete results from the research, which was carried out by US government agency the National Institute of Allergy and Infectious Diseases (NIAID), were published by leading medical periodical the New England Journal of Medicine.
The United States authorized the emergency use of remdesivir in hospitals on May 1, followed by Japan, while Europe is considering following suit.
The study found that remdesivir, injected intravenously daily for 10 days, accelerated the recovery of hospitalized COVID-19 patients compared to a placebo in clinical tests on just over a thousand patients across 10 countries.
On April 29, NIAID director Anthony Fauci, who has become the US government’s trusted face on the coronavirus pandemic, said preliminary evidence indicated remdesivir had a “clear-cut, significant and positive effect in diminishing the time to recovery.”
The National Institutes of Health, of which the NIAID is a part, said Friday in a statement online that investigators found “remdesivir was most beneficial for hospitalized patients with severe disease who required supplemental oxygen.”
But the authors of the trial wrote that the drug did not prevent all deaths.
“Given high mortality despite the use of remdesivir, it is clear that treatment with an anti-viral drug alone is not likely to be sufficient,” they said.
About 7.1 percent of patients given remdesivir in the trial group died within 14 days — compared with 11.9 percent in the placebo group.
However, the result is just below the statistical reliability threshold, meaning it could be down to chance rather than the capability of the drug.

 fox59.com
Here, Dr. Box has taken a lot of heat from reporters for not naming LTC facilities. When I read the reports from 3 facilities not in compliance, I wondered if that was the reason she didn't want to get into that mess. Now I'm thinking it might be a delay tactic. I don't think the shutdown would have been nearly so successful if we had known where the deaths actually came from. In my county, between the 45 LTC deaths and the 6 or 7 prison deaths, there are only 13 or 14 deaths that may be considered community related.PA has done several revisions of the daily reporting format in the past week and I am beginning to think that masking just such realities about LTC is the reason. You now have to go to three separate links to figure out that close to 80% ( guessing here) of deaths in my county come from LTCs.
 www.kff.org
That actually looks right. But you won't believe this but they changed the format again. You used to go to a link for cases in LTC and then scroll down to find your county. I just now checked and ALL of the homes in the state are listed in alphabetical order and you have to scroll through very fine print to find the ones in your County.Here, Dr. Box has taken a lot of heat from reporters for not naming LTC facilities. When I read the reports from 3 facilities not in compliance, I wondered if that was the reason she didn't want to get into that mess. Now I'm thinking it might be a delay tactic. I don't think the shutdown would have been nearly so successful if we had known where the deaths actually came from. In my county, between the 45 LTC deaths and the 6 or 7 prison deaths, there are only 13 or 14 deaths that may be considered community related.
See of the Kaiser dashboard aligns with your PA dashboard:
It shows PA LTCF deaths as a percentage of state deaths: 61% as of 5/19

Global COVID-19 Tracker | KFF
This tracker provides data on global COVID-19 cases and deaths by country, region, and income-level. Additionally, the tracker reports current closure, economic, and health system policy responses to the COVID-19 pandemic globally. This tracker will be updated as new data are available.
www.health.pa.gov
| Total Cases* | Deaths | Negative** | Recovered*** |
| 67,713 | 5,124 | 328,382 | 60% |
| Confirmed Cases | Probable Case by Definition and High-Risk Exposure | Probable Case by Serology Test and Either Symptoms or High-Risk Exposure |
| 65,906 | 1,807 | 531 |
| Age Range | Percent of Cases* |
| 0-4 | < 1% |
| 5-12 | < 1% |
| 13-18 | 2% |
| 19-24 | 6% |
| 25-49 | 37% |
| 50-64 | 25% |
| 65+ | 29% |
| Age Range | Percent of Cases* |
| 0-4 | < 1% |
| 5-12 | < 1% |
| 13-18 | < 1% |
| 19-24 | 1% |
| 25-49 | 16% |
| 50-64 | 26% |
| 65+ | 57% |
| County | Total Cases | Negatives |
| Adams | 226 | 2722 |
| Allegheny | 1777 | 26461 |
| Armstrong | 58 | 1119 |
| Beaver | 554 | 3293 |
| Bedford | 37 | 644 |
| Berks | 3885 | 10311 |
| Blair | 46 | 2421 |
| Bradford | 44 | 1323 |
| Bucks | 4867 | 16992 |
| Butler | 219 | 3391 |
| Cambria | 57 | 3220 |
| Cameron | 2 | 118 |
| Carbon | 229 | 2039 |
| Centre | 146 | 1879 |
| Chester | 2390 | 10419 |
| Clarion | 29 | 644 |
| Clearfield | 34 | 943 |
| Clinton | 50 | 517 |
| Columbia | 344 | 1204 |
| Crawford | 22 | 979 |
| Cumberland | 592 | 4235 |
| Dauphin | 1099 | 8910 |
| Delaware | 6179 | 17938 |
| Elk | 6 | 287 |
| Erie | 209 | 3866 |
| Fayette | 94 | 2914 |
| Forest | 7 | 64 |
| Franklin | 734 | 4666 |
| Fulton | 14 | 192 |
| Greene | 27 | 704 |
| Huntingdon | 228 | 748 |
| Indiana | 89 | 1151 |
| Jefferson | 7 | 471 |
| Juniata | 95 | 309 |
| Lackawanna | 1491 | 5523 |
| Lancaster | 2854 | 13987 |
| Lawrence | 74 | 1140 |
| Lebanon | 909 | 4129 |
| Lehigh | 3651 | 12611 |
| Luzerne | 2645 | 9679 |
| Lycoming | 158 | 1996 |
| McKean | 11 | 490 |
| Mercer | 104 | 1338 |
| Mifflin | 58 | 1138 |
| Monroe | 1304 | 5109 |
| Montgomery | 6525 | 30605 |
| Montour | 50 | 3143 |
| Northampton | 2911 | 11832 |
| Northumberland | 170 | 1277 |
| Perry | 47 | 623 |
| Philadelphia | 17384 | 50067 |
| Pike | 477 | 1869 |
| Potter | 4 | 132 |
| Schuylkill | 585 | 4181 |
| Snyder | 38 | 364 |
| Somerset | 37 | 1527 |
| Sullivan | 2 | 84 |
| Susquehanna | 96 | 672 |
| Tioga | 16 | 495 |
| Union | 53 | 988 |
| Venango | 8 | 460 |
| Warren | 3 | 325 |
| Washington | 138 | 3823 |
| Wayne | 117 | 884 |
| Westmoreland | 440 | 8275 |
| Wyoming | 33 | 419 |
| York | 924 | 12103 |
| Sex | Positive Cases | Percent of Cases |
| Female | 37,216 | 55% |
| Male | 29,809 | 44% |
| Neither | 3 | 0% |
| Not reported | 685 | 1% |
| Race | Positive Cases | Percent of Cases |
| African American/Black | 8136 | 12% |
| Asian | 914 | 1% |
| White | 18,069 | 27% |
| Other | 380 | 1% |
| Not reported | 40,214 | 59% |
| Region | Positive | Negative | Inconclusive |
| Northcentral | 1007 | 13402 | 17 |
| Northeast | 12660 | 50637 | 140 |
| Northwest | 434 | 11125 | 19 |
| Southcentral | 4835 | 42840 | 78 |
| Southeast | 43696 | 154500 | 906 |
| Southwest | 3274 | 55878 | 44 |
This is from today's update on the state dashboard, your county has 91 total deaths. Look at the death demographic = no one under the age of 50 has died of Covid in Hamilton Co.Yep! That’s my usual day off anyway but yeah, today and tomorrow off (closed on Sunday)....
there’s one thing I don’t miss about opening back up by the way and that’s the traffic easing back in. At first it was super creepy driving to work and back seeing maybe 5 cars total but now I kind of resent it lol! As in, “ hey, I was here first while you all were laying in bed watching movies, so don’t you dare honk your horn at me” ha!
Anyway, I had a big feeling nursing homes in this town weren’t telling the truth from the very beginning about the infections and deaths.
Lots of chatter about our “lovely mayor” trying to hide statistics, too. (He’s an arrogant Rhino, we’ve tried to elect a better conservative mayor for years but there’s only been a couple of people actually try to run against him. I would be willing to bet you he cheats, somehow.
On those days that the deaths were shown to be high in the statistics you post, I could almost swear, I heard a lot of sirens in those areas. In fact, I’m positive I did one particular day.


Searching LTCFs is a challenge, to put it mildly. If you're only interested in one county, it's not too bad but beyond that...That actually looks right. But you won't believe this but they changed the format again. You used to go to a link for cases in LTC and then scroll down to find your county. I just now checked and ALL of the homes in the state are listed in alphabetical order and you have to scroll through very fine print to find the ones in your County.
Pennsylvania COVID-19 Numbers
Current number of positive results, age breakdowns, hospitalizations, and more.
COVID-19 Data for Pennsylvania*
* Map, tables, case counts and deaths last updated at 12:00 p.m. on 5/24/2020
Source: Pennsylvania National Electronic Disease Surveillance System (PA-NEDSS) as of 12:00 a.m. on 5/24/2020
Page last updated: 12:00 p.m. on 5/24/2020
Case Counts, Deaths, and Negatives
Total Cases* Deaths Negative** Recovered*** 67,713 5,124 328,382 60%
* Total case counts include confirmed and probable cases.
** Negative case data only includes negative PCR tests. Negative case data does not include negative antibody tests.
*** Individuals who have recovered is determined using a calculation, similar to what is being done by several other states. If a case has not been reported as a death, and it is more than 30 days past the date of their first positive test (or onset of symptoms) then an individual is considered recovered.
Confirmed Cases Probable Case by Definition and High-Risk Exposure Probable Case by Serology Test and Either Symptoms or High-Risk Exposure 65,906 1,807 531
Hospital Data
Trajectory Animations
- View hospital dataOpens In A New Window (desktop version)
- View hospital dataOpens In A New Window (mobile version)
Positive Cases by Age Range to Date
* Percentages may not total 100% due to rounding
Age Range Percent of Cases* 0-4 < 1% 5-12 < 1% 13-18 2% 19-24 6% 25-49 37% 50-64 25% 65+ 29%
Hospitalization Rates by Age Range to Date
Age Range Percent of Cases* 0-4 < 1% 5-12 < 1% 13-18 < 1% 19-24 1% 25-49 16% 50-64 26% 65+ 57%
* Percentages may not total 100% due to rounding
Death Data
County Case Counts to Date
County Total Cases Negatives Adams 226 2722 Allegheny 1777 26461 Armstrong 58 1119 Beaver 554 3293 Bedford 37 644 Berks 3885 10311 Blair 46 2421 Bradford 44 1323 Bucks 4867 16992 Butler 219 3391 Cambria 57 3220 Cameron 2 118 Carbon 229 2039 Centre 146 1879 Chester 2390 10419 Clarion 29 644 Clearfield 34 943 Clinton 50 517 Columbia 344 1204 Crawford 22 979 Cumberland 592 4235 Dauphin 1099 8910 Delaware 6179 17938 Elk 6 287 Erie 209 3866 Fayette 94 2914 Forest 7 64 Franklin 734 4666 Fulton 14 192 Greene 27 704 Huntingdon 228 748 Indiana 89 1151 Jefferson 7 471 Juniata 95 309 Lackawanna 1491 5523 Lancaster 2854 13987 Lawrence 74 1140 Lebanon 909 4129 Lehigh 3651 12611 Luzerne 2645 9679 Lycoming 158 1996 McKean 11 490 Mercer 104 1338 Mifflin 58 1138 Monroe 1304 5109 Montgomery 6525 30605 Montour 50 3143 Northampton 2911 11832 Northumberland 170 1277 Perry 47 623 Philadelphia 17384 50067 Pike 477 1869 Potter 4 132 Schuylkill 585 4181 Snyder 38 364 Somerset 37 1527 Sullivan 2 84 Susquehanna 96 672 Tioga 16 495 Union 53 988 Venango 8 460 Warren 3 325 Washington 138 3823 Wayne 117 884 Westmoreland 440 8275 Wyoming 33 419 York 924 12103
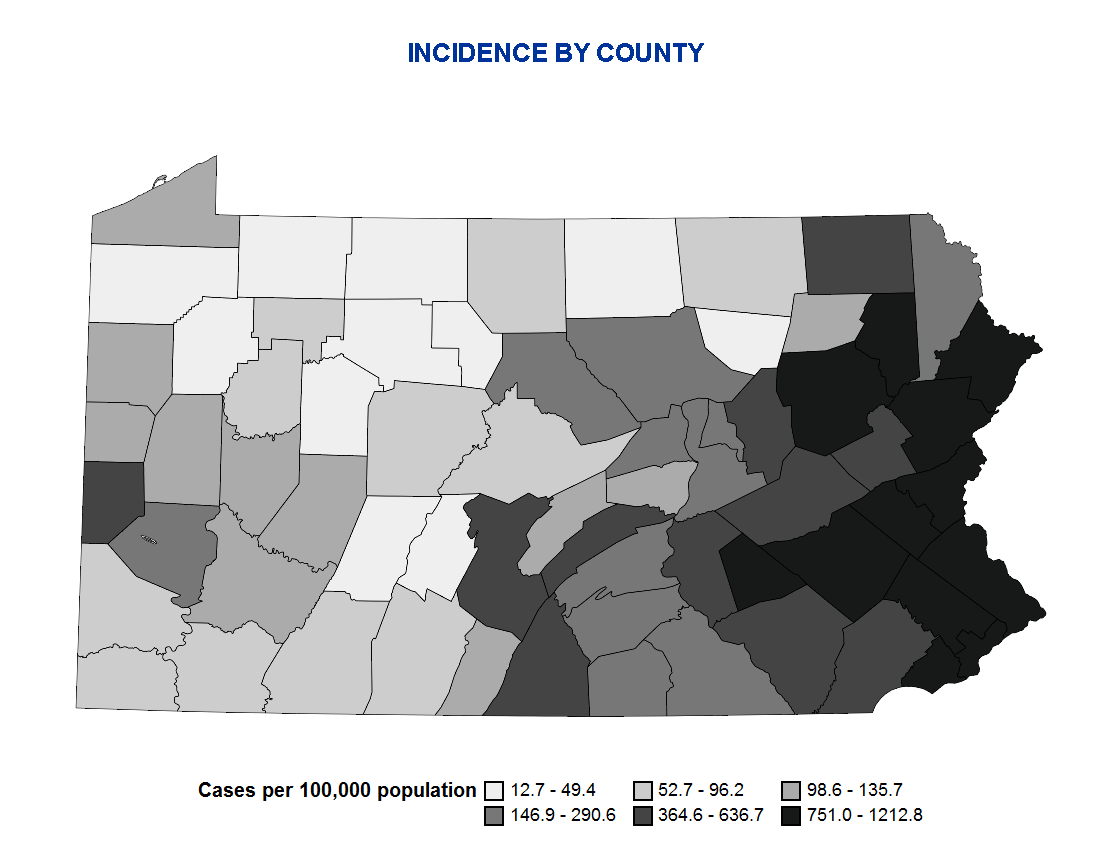
Incidence by County
Incidence is calculated by dividing the current number of confirmed and probable COVID-19 cases reported to the Department by the 2018 county population data available from the Bureau of Health Statistics. The counties are divided into 6 relatively equally-sized groups based on their incidence rate (i.e. sestiles). Cases are determined using a national COVID-19 case definition. There currently is no way to estimate the true number of infected persons. Incidence rates are based on the number of known cases, not the number of true infected persons.
Case Counts by Sex to Date
* Percentages may not total 100% due to rounding
Sex Positive Cases Percent of Cases Female 37,216 55% Male 29,809 44% Neither 3 0% Not reported 685 1%
Case Counts by Race to Date*
* 59% of race is not reported. Little data is available on ethnicity.
Race Positive Cases Percent of Cases African American/Black 8136 12% Asian 914 1% White 18,069 27% Other 380 1% Not reported 40,214 59%
** Percentages may not total 100% due to rounding
Case Counts by Region to Date
Region Positive Negative Inconclusive Northcentral 1007 13402 17 Northeast 12660 50637 140 Northwest 434 11125 19 Southcentral 4835 42840 78 Southeast 43696 154500 906 Southwest 3274 55878 44
EpiCurve by Region
Case counts are displayed by the date that the cases were first reported to the PA-NEDSS surveillance system. Case counts by date of report can vary significantly from day to day for a variety of reasons. In addition to changes due to actual changes in disease incidence, trends are strongly influenced by testing patterns (who gets tested and why), testing availability, lab analysis backlogs, lab reporting delays, new labs joining our electronic laboratory reporting system, mass screenings, etc. Trends need to be sustained for at least 2-3 weeks before any conclusions can be made regarding the progress of the pandemic.
COVID-19 Cases Associated with Nursing Homes and Personal Care Homes to Date
This data represents long-term care facilities in Pennsylvania, including Department of Health and Department of Human Services regulated facilities.
- COVID-19 Long-Term Care Facilities Data (updated 5/22/2020 at 3:00 p.m.)
The LTCF data will be updated on Tuesday, May 26, 2020.


