If AGW was a thing then it would show up in the temperature records. Spoiler: it doesn't, and a discussion on why follows the list.

electroverse.net
LIST OF HISTORICAL TEMPERATURE EXTREMES BY U.S. STATE SHOWS NO SIGN OF GLOBAL WARMING
OCTOBER 10, 2020 CAP ALLON
Below I’ve compiled a list of the hottest and coldest temperatures ever recorded in each U.S. state, according to NOAA data. Surely, if catastrophic global warming was actually a thing then it would show up in the temperature records. Spoiler: it doesn’t, and a discussion on why follows the list.
ALABAMA
– All-time highest temperature: 112° F (Centreville on Sept. 6, 1925)
– All-time lowest temperature: -27° F (New Market 2 on Jan. 30, 1966)
ALASKA
– All-time highest temperature: 100° F (Fort Yukon on June 27, 1915)
– All-time lowest temperature: -80° F (Prospect Creek on Jan. 23, 1971)
ARIZONA
– All-time highest temperature: 128° F (Lake Havasu City on June 29, 1994)
– All-time lowest temperature: -40° F (Hawley Lake on Jan. 7, 1971)
ARKANSAS
All-time highest temperature: 120° F (Ozark on Aug.10, 1936)
– All-time lowest temperature: -29° F (Gravette on Feb.13, 1905)
CALIFORNIA
– All-time highest temperature: 134° F (Greenland Ranch on July 10, 1913)
– All-time lowest temperature: -45° F (Boca on Jan. 20, 1937)
COLORADO
– All-time highest temperature: 115° F (John Martin Reservoir on July 20, 2019)
– All-time lowest temperature: -61° F (Maybell on Feb. 1, 1985)
CONNECTICUT
– All-time highest temperature: 106° F (Torrington on Aug. 23, 1916)
– All-time lowest temperature: -32° F (Falls Village on Feb. 16, 1943)
DELAWARE
– All-time highest temperature: 110° F (Millsboro on July 21, 1930)
– All-time lowest temperature: -17° F (Millsboro on Jan. 17, 1893)
FLORIDA
– All-time highest temperature: 109° F (Monticello 5 SE on June 29, 1931)
– All-time lowest temperature: -2° F (Tallahassee on Feb.13, 1899)
GEORGIA
– All-time highest temperature: 112° F (Lousiville on July 24, 1952)
– All-time lowest temperature: 17 °F (N. Floyd County on Jan 27, 1940)
HAWAII
– All-time highest temperature: 100° F (Pahala 21 on April 27, 1931)
– All-time lowest temperature: 12° F (Mauna Kea Observatory on May 17, 1979)
IDAHO
– All-time highest temperature: 118° F (Orofino on July 28, 1934)
– All-time lowest temperature: -60° F (Island Park on Jan.18, 1943)
ILLINOIS
– All-time highest temperature: 117° F (East St. Louis on July 14, 1954)
– All-time lowest temperature: −38 °F (Mt Carroll, Illinois on Jan 31, 2019)
INDIANA
– All-time highest temperature: 116° F (Collegeville St Joseph County Airport on July 14, 1936)
– All-time lowest temperature: -36° F (New Whiteland on Jan. 19, 1994)
IOWA
– All-time highest temperature: 118° F (Keokuk No 2 on July 20, 1934)
– All-time lowest temperature: -47° F (Elkader 6 SSW on Feb. 3, 1996)
KANSAS
– All-time highest temperature: 121° F (Alton on July 24, 1936)
– All-time lowest temperature: -40° F (Lebanon on Feb 13, 1905)
KENTUCKY
– All-time highest temperature: 114° F (Greensburg on July 28, 1930)
– All-time lowest temperature: -37° F (Shelbyville 1 E on Jan. 19, 1994)
LOUISIANA
– All-time highest temperature: 114° F (Plain Dealing on Aug. 10, 1936)
– All-time lowest temperature: -16° F (Minden on Feb. 13, 1899)
MAINE
– All-time highest temperature: 105° F (North Bridgton on July 10, 1911)
– All-time lowest temperature: -50° F (Big Black River (near Saint Pamphile, Pq) on Jan. 16, 2009)
MARYLAND
– All-time highest temperature: 109° F (Cumberland on Aug. 6, 1918)
– All-time lowest temperature: -40° F (Oakland 1 SE on Jan.13, 1912)
MASSACHUSETTS
– All-time highest temperature: 107° F (Chester 2 on Aug. 2, 1975)
– All-time lowest temperature: -35° F (Coldbrook on Feb.15, 1943)
MICHIGAN
– All-time highest temperature: 112° F (Stanwood on July 13, 1936)
– All-time lowest temperature: -51° F (Vanderbilt 11ENE on Feb. 9, 1934)
MINNESOTA
All-time highest temperature: 115° F (Beardsley on July 29, 1917)
– All-time lowest temperature: -60° F (Tower 2S on Feb. 2, 1996)
MISSISSIPPI
– All-time highest temperature: 115° F (Holly Springs 2 N on July 29, 1930)
– All-time lowest temperature: -19° F (Corinth 7 SW on Jan. 30, 1966)
MISSOURI
– All-time highest temperature: 118° F (Warsaw 1 on July 14, 1954)
– All-time lowest temperature: -40° F (Warsaw 1 on Feb. 13, 1905)
MONTANA
– All-time highest temperature: 117° F (Glendive on July 20, 1893
and Medicine Lake on July 5, 1937)
– All-time lowest temperature: -70° F (Rogers Pass on Jan 20, 1954)
NEBRASKA
– All-time highest temperature: 118° F (Geneva on July 15, 1934)
– All-time lowest temperature: -47° F (Oshkosh on Dec. 22, 1989)
NEVADA
– All-time highest temperature: 125° F (Laughlin on June 29, 1994)
– All-time lowest temperature: -50° F (San Jacinto on Jan. 8, 1937)
NEW HAMPSHIRE
– All-time highest temperature: 106° F (Nashua on July 4, 1911)
– All-time lowest temperature: -47° F (Mount Washington Jan 29, 1934)
NEW JERSEY
– All-time highest temperature: 110° F (Runyon on July 10, 1936)
– All-time lowest temperature: -34° F (River Vale on Jan. 5, 1904)
NEW MEXICO
– All-time highest temperature: 122° F (Waste Isolt’n Pilot Plt on June 27, 1994)
– All-time lowest temperature: -50° F (Gavilan on Feb. 1, 1951)
NEW YORK
– All-time highest temperature: 108° F (Troy on July 22, 1926)
– All-time lowest temperature: -52° F (Old Forge on Feb. 18, 1979)
NORTH CAROLINA
– All-time highest temperature: 110° F (Fayetteville Regional Airport Grannis Field on Aug. 21, 1983)
– All-time lowest temperature: -34° F (Mt. Mitchell on Jan. 21, 1985)
NORTH DAKOTA
– All-time highest temperature: 121° F (Steele 4N on July 6, 1936)
– All-time lowest temperature: -60° F (Parshall on Feb. 15, 1936)
OHIO
– All-time highest temperature: 113° F (Gallipolis on July 21, 1934)
– All-time lowest temperature: -39° F (Milligan on Feb. 10, 1899)
OKLAHOMA
– All-time highest temperature: 120° F (Poteau on Aug. 10, 1936)
– All-time lowest temperature: -31° F (Nowata on Feb. 10, 2011)
OREGON
– All-time highest temperature: 119° F (Pendleton Downtown on Aug. 10, 1898)
– All-time lowest temperature: -54° F (Seneca on Feb. 10, 1933)
PENNSYLVANIA
– All-time highest temperature: 111° F (Phoenixville 1 E on July 10, 1936)
– All-time lowest temperature: -42° F (Smethport on Jan. 5, 1904)
RHODE ISLAND
– All-time highest temperature: 111° F (Providence on Aug 2, 1975)
– All-time lowest temperature: -25° F (Greene on Feb 5, 1996)
SOUTH CAROLINA
– All-time highest temperature: 113° F (Columbia Univ. of S.C. on June 29, 2012)
– All-time lowest temperature: -19° F (Caesars Head on Jan. 21, 1985)
TENNESSEE
– All-time highest temperature: 113° F (Perryville on Aug. 9, 1930)
– All-time lowest temperature: -32° F (Mountain City on Dec. 30, 1917)
TEXAS
– All-time highest temperature: 120° F (Seymour 3NW on Aug.12, 1936)
– All-time lowest temperature: -23° F (Tulia Near on Feb.12, 1899)
UTAH
– All-time highest temperature: 117° F (St. George on July 5, 1985)
– All-time lowest temperature: -50° F (East Portal on Jan. 5, 1913)
VERMONT
– All-time highest temperature: 107° F (Vernon on July 7, 1912)
– All-time lowest temperature: -50° F (Bloomfield on Dec. 30, 1933)
VIRGINIA
– All-time highest temperature: 110° F (Balcony Falls on July 15, 1954)
– All-time lowest temperature: -30° F (Mount Lake Biological Station on Jan. 21, 1985)
WASHINGTON
– All-time highest temperature: 118° F (Ice Harbor Dam on Aug.5, 1961)
– All-time lowest temperature: -48° F (Winthrop 1 WSW on Dec. 30, 1968)
WEST VIRGINIA
– All-time highest temperature: 112° F (Moorefield 1 SSE on Aug.4, 1930)
– All-time lowest temperature: -37° F (Lewisburg 3 N on Dec.30, 1917)
WISCONSIN
– All-time highest temperature: 114° F (Wisconsin Dells on July 13, 1936)
– All-time lowest temperature: -55° F (Couderay 7 W on Feb. 4, 1996)
WYOMING
– All-time highest temperature: 115° F (Basin on Aug. 8, 1983)
– All-time lowest temperature: -66° F (Riverside Ranger Station, Yellowstone National Park) on Feb. 9, 1933)
More than 210 degrees Fahrenheit separates the highest and the lowest temperatures on record in the United States, and it isn’t a coincidence that the majority of these temperatures records –for both hot and cold– occur during
solar minimums.
This is because low solar activity weakens the jet stream, reverting its usual tight ZONAL flow to more of a wavy MERIDIONAL one. This violent “buckling” effect FULLY explains how regions can experience pockets of anomalous heat while others, even relatively nearby, can be dealing with blobs of record cold: basically, in the NH, Arctic cold is dragged anomalously far south and Tropical warmth is pushed unusually far north
(for more see the two links below).
This explains why far-northern latitudes (Siberia) have been experiencing anomalous heat of late, while the lower-latitudes have been suffering record cold.
electroverse.net
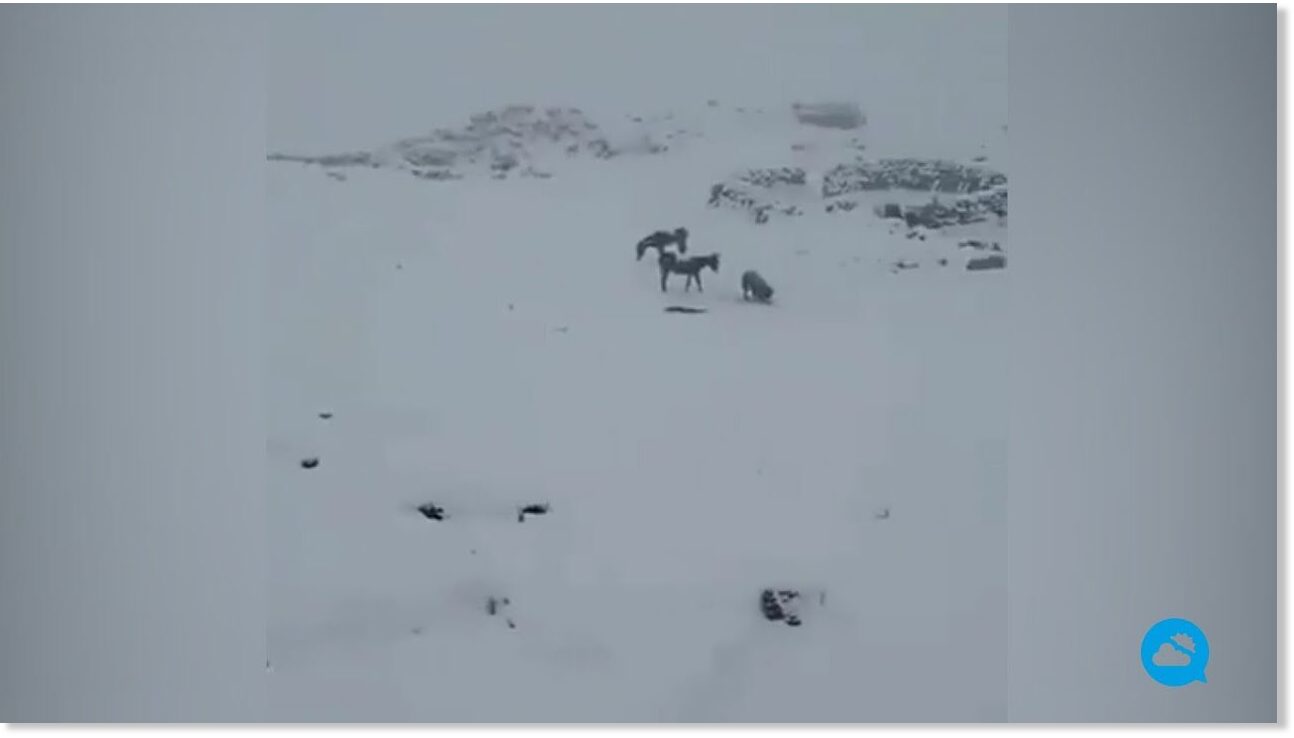
Intense bursts of heat will linger in one area, while a teeth-chattering chill will dominate nearby -- and then the regions will "switch". GSM.
electroverse.net
(Continued below)