Solar Grand Solar Minimum part deux

TxGal

Day by day
Major Winter Storm Slamming California - Ice Age Now

Major Winter Storm Slamming California
January 28, 2021 by Robert

  • Already more than 4 feet of snow across the central Sierra Nevada.
  • Widespread additional 1 to 3 feet of snow expected
  • Travel extremely dangerous and impossible at times.
  • Bitter wind chills for much of the East coast.
  • Will feel like 25 degrees below zero at times across Interior Northeast.

“A major winter storm with an active atmospheric river is inundating California with a tremendous amount of moisture,” warns the National Weather Service. Then comes accumulating snowfall for the Midwest and cold, cold, cold.

Heavy to excessive rainfall is likely from central to southern California that may produce dangerous flash flooding along with mudslides and dangerous debris flows near recent and vulnerable burn scars. A significant amount of snow is likely for the California mountains and terrain.

NWS Weather Prediction Center College Park MD
Valid Fri Jan 29 2021 – Sun Jan 31 2021

Heavy rain and flash flooding remains possible across portions of southern California tonight.

Additional heavy snow expected across the Sierra Nevada through early Friday.

Low pressure system to develop over the central Plains Saturday and bring accumulating snowfall to parts of the Midwest.

Ongoing heavy precipitation continues to unfold across central and southern California this afternoon as an atmospheric river swings through the region.

Up to 12 inches of rain has already fallen along coastal areas, with more than 4 feet of snow across the central Sierra Nevada.

Heavy rain going into tonight will shift to coastal sections of southern California where up to 3 inches of rain is expected to fall, with locally higher amounts. Flash flooding and debris flows will be possible near recent burn scars, as soil cannot retain much rain in a short amount of time. Flash Flood Watches are currently in effect.

Meanwhile, heavy snow is expected to continue through Friday morning across the central and southern Sierra Nevada. A widespread additional 1 to 3 feet of snow can be expected, making travel extremely dangerous and impossible at times.

This same system is forecast to exit the Southwest U.S. by Friday evening, with lingering snow showers remaining throughout the Great Basin and Intermountain West. Cold arctic air to the north of the system will allow for precipitation to fall as snow from eastern Nebraska to Indiana.

More wintry weather will be likely with this storm as it tracks east later in the weekend.

Elsewhere, much of the East Coast will be dealing with bitter wind chills tonight into Friday morning. Wind Chill advisories are in effect across the Interior Northeast, where it will feel like 25 degrees below zero (-31.7C) at times. Snow showers will also accompany the cold air along immediate coastal sections of New England through Friday.

WPC's Short Range Public Discussion
 

TxGal

Day by day
Blizzard Continues Blasting The Sierra Nevada - 80,000 Without Power - Cyclical Deluges - YouTube

Blizzard Continues Blasting The Sierra Nevada - 80,000 Without Power - Cyclical Deluges
4,628 views • Premiered 11 hours ago

View: https://youtu.be/dgrZQBAg760

Run time is 4:38

Synopsis provided:

Blizzard continues blasting the Sierra Nevada http://bit.ly/3ablxQo
SNOWFALL ANALYSIS FROM THE LAST 48 HOURS https://www.weather.gov/crh/snowfall
Blizzard delivers up to 14 inches of snow to Tahoe overnight http://bit.ly/2YCcvXv
Tens Of Thousands Without Power As Winter Storm Pummels Northern California https://bit.ly/36mKTK3
https://poweroutage.us/
GFS Model Total Snow http://bit.ly/2Yq9Oba
GFS Model Total Precipitated Water http://bit.ly/3t1nd7T
Cyclical Deluges
http://bit.ly/2YlGLFQ
 

TxGal

Day by day
California Snowstorm: Stalled Atmospheric River "On Steroids" Delivers 4 Feet of Snow in 24 Hours - Electroverse

California_Storms_21028816262452-696x464-1.jpg


CALIFORNIA SNOWSTORM: STALLED ATMOSPHERIC RIVER “ON STEROIDS” DELIVERS 4 FEET OF SNOW IN 24 HOURS
JANUARY 29, 2021 CAP ALLON

This week’s blast of wintry weather walloped the Cali region thanks to a stalled atmospheric river “on steroids” said Meteorologist Reed Timmer on Twitter, blanketing inland areas of the state with dizzying snow totals.

As reported by upi.com, Mammoth Ski Resort, along the east side of the Sierra Nevada mountain range, received 4 feet of snow fell in just 24 hours, boosting the current storm total to a whopping 7.2 feet.

View: https://twitter.com/Joyce063/status/1354954856260231176


Nearby Yosemite National Park is closed for the foreseeable due to powerful winds and destructive snow totals. As reported by ecowatch.com, an area of the park that had recently undergone a $40 million renovation was destroyed when two massive sequoias fell in the extreme conditions — destroying millions of dollars worth of vehicles, employee homes, and other facilities.

View: https://twitter.com/YosemiteNPS/status/1354899494442164226


The California Highway Patrol closed a 75-mile stretch of Interstate 80 following multiple spinouts along the key route east of Sacramento to the Nevada border west of Reno.

“I would not venture into the Sierra if you don’t have to,” National Weather Service meteorologist Alex Hoon in Reno tweeted.

View: https://twitter.com/bclemms/status/1354892370903359495


The plunging polar destruction also left more than 575,000 people without power in the state, with Pacific Gas & Electric desperately trying to reconnect homes before the next wave hits: as explained by AccuWeather senior meteorologist Alex Sosnowski, the worst of the storms may still lie ahead.

“The storm is far from over, and in much of Southern California, the worst of the storm is yet to come. Rain, snow and wind from the storm are forecast to continue across the state into Friday.

“Meteorologists have been sounding the alarm that the potent storm will bring extreme impacts. Peak winds will continue to top hurricane force of 74 mph or greater,” warned Sosnowski.


Plunging jet stream: Atmospheric rivers are long, narrow regions in the atmosphere — like rivers in the sky — that transport water vapor.

Further ‘snowfall duration records’ will be toppled.


GFS Total Snowfall Jan. 29 to Feb. 14 [tropicaltidbits.com].

The COLD TIMES are returning, the mid-latitudes are REFREEZING in line with the great conjunction, historically low solar activity, cloud-nucleating Cosmic Rays, and a meridional jet stream flow (among other forcings).

Both NOAA and NASA appear to agree, if you read between the lines, with NOAA saying we’re entering a ‘full-blown’ Grand Solar Minimum in the late-2020s, and NASA seeing this upcoming solar cycle (25) as “the weakest of the past 200 years”, with the agency correlating previous solar shutdowns to prolonged periods of global cooling here.

Furthermore, we can’t ignore the slew of new scientific papers stating the immense impact The Beaufort Gyre could have on the Gulf Stream, and therefore the climate overall.


Prepare accordinglylearn the facts, relocate if need be, and grow your own.
 

TxGal

Day by day
It is now overdue for the next ice age to start - Ice Age Now

It is now overdue for the next ice age to start
January 29, 2021 by Robert

There is nothing we can do to stop it but we may be able to learn to live with it.

______________

It is now overdue for the next ice age to start

Joseph Kraig

The earth has been warming from way before man used fossil fuels. We’ve been warming since the end of the last Ice Age, it’s normal and it is normal for sea levels to rise with the warming as ice melts.

For the last couple million years or so we’ve had ice ages that have lasted about one hundred thousand years and then warmed a little for about ten thousand years. We are at the long end of one of those ten-thousand year periods. It is now overdue for the next ice age to start. There is nothing we can do to stop it but we may be able to learn to live with it.

We need to harness nuclear and fossil fuels to the best of our ability. We need to learn how to indoor farm.

Perhaps we can reduce the depth, that is keep the ice farther north than in the past ice ages by spreading soot, coal ash over snow in lower latitudes, but we must stop this insane idea of man-made global warming.

Instead of thinking of blocking the sun as Bill Gates proposes we need to learn how to reflect more of it to earth.

Previous to the present age the most wonderful time for mankind and civilization was the Roman Warm period. We still aren’t as warm as then. Temperatures have been falling for the last 8,000 years.

Holocene_Temperature_Variations-w-Cooling-Arrow-1.jpg


The worst time in modern history was the Maunder Minimum, or what we now call the Dark Ages. Millions of people died of starvation, disease and wars. When we started warming after the Maunder we called that period the awakening or Renaissance. The next mini ice age or full on ice age could easily kill Billions.

Ignorance is not bliss. Al gore was at the bottom of his class. Bill Gates was a drop out. They could possibly be intelligent but they are ignorant about climate science.

The truth is easy to find if you look. Don’t take the word of people who don’t have facts. When someone tells you this is the warmest period in history you know they are ignorant of the truth or liars, look at temperatures from just 90 years ago.

Read, don’t be ignorant.
 

TxGal

Day by day
It’s not warmth we need to fear; it’s the ferocious cold of the next glacial period - Ice Age Now

It’s not warmth we need to fear; it’s the ferocious cold of the next glacial period
January 29, 2021 by Robert

Paleo-climate studies show us unequivocally that a warmer world has always been a more liveable and more abundant world.

_____________

It’s not warmth we need to fear; it’s the ferocious cold of the next glacial period
Interested

I think it’s important to be careful of our terminology when it comes to describing climate. Otherwise there’s a danger of confusion.

In geological terms, during any time period when there’s a permanent (perennial) ice cap at either pole, Earth is said to be in an ice age. For maybe 85% of geological history, there were no permanent ice caps at the poles, so polar ice caps – and therefore ice ages – are unusual.

Around 34 million years ago, an ice-free Antarctica started to accumulate permanent ice, due to the breaking of the land bridge between Antarctica and South America, which allowed the establishment of the circumpolar ocean current. So, in correct geological terms, Earth has been in an ice age continuously since that time.

The Arctic also grew a semi-permanent ice cap about 2-3 million years ago, although it’s clearly thinner and much more prone to occasional melting. Having a permanent ice cap at BOTH poles at the same time is especially unusual and tells us our planet is currently much colder than normal.

So, we’ve been in the same ice age for 34 million years now. Only the severity of the cold varies, in a cyclical pattern, with full glacial conditions lasting some 90,000-100,000 years interrupted by milder interglacial periods of about 10,000 years in between.

Our current interglacial warm spell, called the Eocene, started around 10,000-11,000 years ago and all of the human history we know of has occurred during that time. But yes, time is running out and the Eocene isn’t going to last very much longer.

We’re going to need a means to keep warm for the next 90,000 years and windmills and solar panels won’t achieve that. We may have enough fossil fuels for the next couple of centuries and atomically fissile and fertile elements like uranium, plutonium, and thorium may give us another thousand years beyond that. But either successful fusion reactors or currently unknown energy sources will be needed for the rest of the imminent glacial period.

The fear of global warming is a contrived fear born of political motives.

Paleo-climate studies show us unequivocally that a warmer world has always been a more liveable and more abundant world. It’s not warmth we need to fear; it’s the ferocious cold of the next glacial period.
 

TxGal

Day by day
Hikers Rescued After Two Days Trapped in Arizona Snow - Ice Age Now

Hikers Rescued After Two Days Trapped in Arizona Snow
January 29, 2021 by Robert

California storm now headed across the U.S. will soon dump snow on Tennessee, Wisconsin, Virginia, West Virginia, Missouri, Ohio, Nebraska, Kansas, Illinois, Indiana, Minnesota, Pennsylvania, Maryland, New Jersey, New York, Rhode Island, Massachusetts, Connecticut, Maine, Vermont and New Hampshire before blasting Nova Scotia.

Five inches, eight inches, up to 12 inches of snow in some areas.
……..

Hikers Rescued After Two Days Trapped in Arizona Snow

28 Jan 2021 -Several hikers were airlifted out of a canyon in Sedona after two days trapped in 8 inches of snow.
It snowed 8 inches while the group was waiting for help.
The snow also trapped one other hiker near Sierra Vista, Arizona … who was barefoot! (There must be a real story there!

See video:
Hikers Rescued After Two Days Trapped in Arizona Snow - Videos from The Weather Channel | weather.com
……..

Coldest Air of Season to Start Weekend in Northeast
29 Jan 2021
Wind shills as low as -16F

See video:
Coldest Air of Season to Start Weekend in Northeast - Videos from The Weather Channel | weather.com
………

Heavy snow from the Upper Midwest to New England

See video:
Winter Storm Orlena to Hit Midwest, Northeast - Videos from The Weather Channel | weather.com

……..

Winter Storm to Impact Midwest and Northeast Into Next Week
Snowfall in Chicago, Buffalo, Washington D.C., New York, and places in between.

Including Tennessee, Wisconsin, Virginia, West Virginia, Ohio, Illinois, Indiana, Minnesota, Pennsylvania, Maryland, New Jersey, New York, Rhode Island, Massachusetts, Connecticut, Maine, Vermont and New Hampshire.

See video:
Winter Storm to Impact Midwest and Northeast Into Next Week - Videos from The Weather Channel | weather.com

………

Snowy in Truckee, Nevada
Here’s a webcam at the airport.
Webcam | Truckee Tahoe Airport District

………….

California snow cams:
Web Cams
 

TxGal

Day by day
Adapt 2030 has a new podcast out:

Electric Geology and Purposely Covered Up History (DOCUMENTARY) - YouTube

Electric Geology and Purposely Covered Up History (DOCUMENTARY)
5,531 views • Jan 29, 2021

View: https://youtu.be/SwECQPUU8D4

Run time is 48:02

Synopsis provided:

Planetary lightning discharge through Earths past and global cataclysms are human history. Using supersonic wind deposit patterns to locate electric discharge line through the Smokey Mountains from Tennessee to N. Carolina, and along the connecting arc to a secondary filament branch sit the largest Cherokee sites and prehistoric settlements. In N. Carolina south of the shock wave line were witness to plasma displays in the skies, then carved onto the Judaculla Rock after viewing the event from Sylva, N. Carolina looking NW.

Five caves in Tennessee have yielded more to the idea that electric skies and plasma displays recorded around the planet occurred in S.E USA skies as well as the western U.S. With an additional electromagnetic field forming in the outer solar system in 2024, perhaps we should begin looking for massive sink holes and landslides as an indicator that cave art was a warning to future generations.

Simple question : Were Cherokee and Prehistoric Sites Flooded to Hide Global Timelines in East Tennessee.
 

TxGal

Day by day
The Oppenheimer Ranch Project has a new podcast out:

Major Snow Expected From Colorado To Maine - Snow Records Will Fall In PA - Full Moon - Pine Mounds - YouTube

Major Snow Expected From Colorado To Maine - Snow Records Will Fall In PA - Full Moon - Pine Mounds
2,763 views • Premiered 9 hours ago

View: https://youtu.be/9txL_WNDZIQ

Run time is 14:13

Synopsis provided:

Bitter cold, snow coming to Upstate NY: ‘Winter is a long way from over’ http://bit.ly/3r3Ngt5
Snow expected from Colorado to Maine this weekend http://cnn.it/39u4hXm
A winter storm moving East will arrive in Northeast Ohio Sunday http://bit.ly/36sD45I
Steady snow arrives Friday night, powder likely on Saturday http://bit.ly/3j7V5eI
DEEP in Tahoe, good snow for most of the West http://bit.ly/3r49o6z
SNOWFALL ANALYSIS FROM THE LAST 72 HOURS https://www.weather.gov/crh/snowfall
Winter Storm Moves Eastward https://www.weather.gov/
GFS Model Total snow US http://bit.ly/3afu8S9
GFS Model Total Snow NE US http://bit.ly/3oFjx8t
Earthquake swarm in Prestahnúkur volcano Iceland https://icelandgeology.net/
Planetary K-Index http://bit.ly/2Edsotf
Worldwide Volcano News http://bit.ly/2v9JJhO
Karangetang https://s.si.edu/2YpMtq8
and more
 

TxGal

Day by day
Rare snowfall reported on North Carolina's Outer Banks -- Earth Changes -- Sott.net

Rare snowfall reported on North Carolina's Outer Banks

Mark Price
The News and Observer
Thu, 28 Jan 2021 19:23 UTC

rare snow

Snow fell early Thursday on North Carolina's Outer Banks, creating a surreal scene of sea winds scouring beaches with snow flakes and sand.

The flurries came as part of a storm that crossed the state overnight, bringing 5 inches of snow to some eastern counties before crossing over the Outer Banks just before dawn.

Snowfall totals on the barrier islands included nearly an inch at Southern Shores and about a half inch in Duck and Kitty Hawk. Snow also fell in Buxton, Nags Head and Ocracoke, but accumulation was slight, the National Weather Service said.

Images of the snow began appearing just after dawn on social media, including video from the top of the Currituck Beach Lighthouse.


TxGal

Day by day
Not only Slamming California, even the desert southwest is getting snow! - Ice Age Now

Not only Slamming California, even the desert southwest is getting snow!
January 30, 2021 by Robert

27 inches of snow in 72 hours
_____________

Vegas-area ski, snowboard resort, Lee Canyon, reports 27 inches of snow in 72 hours

From: Vegas-area ski, snowboard resort, Lee Canyon, reports 27 inches of snow in 72 hours

LAS VEGAS (KTNV) — You don’t have to travel very far to play in the snow this week if you live in Las Vegas, but head up to Mount Charleston and you’ll find almost 30 inches of fresh powder at Lee Canyon.

The ski and snowboard resort just north of the Las Vegas valley says it received 27 inches of snow in the last 72 hours, bringing its base to 61-inches.

Parts of the Las Vegas valley received snow on Monday and Tuesday as a winter storm swept through the area.

“The main thing about this season is that we wanted to be here for the community,” said Jim Seely, the Lee Canyon marketing director. “We want to be a place where everyone can come escape their routine and maybe some of the constraints that COVID has put on their life,” he said. “We want people to get outdoors.”
 

TxGal

Day by day
Up to a foot of snow likely across Midwest and close to that in Philly, NYC and Boston - Ice Age Now

Up to a foot of snow likely across Midwest and close to that in Philly, NYC and Boston
January 30, 2021 by Robert

Snowfall rates of one to two inches per hour possible. Near blizzard conditions possible near the coast. Travel could be hazardous. (Understatement.)

A complex winter storm will start today in the Midwest with heavy snow from the Upper Mississippi Valley to the Ohio Valley, including the Chicago metro area and eventually into the Northeast, according to the National Weather Service. Chicago should see 5 to 9 inches of snow, its second snowstorm within one week.

On Sunday, the snow and wintry mix will spread into the Mid-Atlantic region. Washington D.C. could see 4 to 6 inches of snow in what could become the city’s biggest snowstorm in two years.

A potential Nor’easter will then intensify and significantly impact portions of the Mid-Atlantic, Northeast and New England on Monday and Tuesday.

By Sunday evening, the snow will move into Philadelphia and by Monday morning, snow will fall heavily along I-95 from Philadelphia to New York City to Boston.

Snowfall rates could reach 1 to 2 inches per hour on Monday and Monday night, the National Weather Service in New York said.

Snow totals are expected to reach 5 to 11 inches in Philadelphia and 6 to 10 inches in New York and Boston.

Snow will develop over parts of the Northern Plains/Upper Mississippi Valley through today.

Meanwhile, snow will develop over parts of the Northern Plains/Upper Mississippi Valley through today.

By this evening, the snow will expand into parts of the Upper Great Lakes and the Ohio Valley. Along the rain/snow line, rain/freezing rain areas will also develop from the Middle Mississippi Valley into the Ohio Valley and into the Central Appalachians and adjacent foothills.

The rain over the Southeast will shift offshore by Monday morning.

Overnight, snow will move into southern portions of the Mid-Atlantic. There will be areas of rain/freezing rain over parts of western Virginia and North Carolina on Sunday.

While the snow will wane over the Upper Midwest overnight Sunday, it will continue over the Ohio Valley, parts of the Great Lakes, and into the Mid-Atlantic through Monday morning.

Meanwhile in the West, multiple fronts will move into the Pacific Northwest/Northern California today. The systems will produce rain and higher elevation snow over the Pacific Northwest and Northern California, continuing through Monday morning.

Near blizzard conditions are possible for the coast, the National Weather Service warned.

WPC's Short Range Public Discussion

National Weather Service

See video:
Latest Timing for Winter Storm Orlena

Snowstorm latest forecast: What you need to know from Midwest to Northeast
 

TxGal

Day by day
New study claims an ice age is coming - Earth's climate is 'cyclical' - Ice Age Now

New study claims an ice age is coming – Earth’s climate is ‘cyclical’
January 31, 2021 by Robert

Short video – Interview with world-famous geologist and earth scientist Professor Ian Plimer. I love this guy’s attitude.
__________

14 Jan 2021 – This interview with Professor Plimer was in response to a Cardiff University study saying that melting icebergs in the Antarctic could actually trigger an ice age. Professor Plimer dismantles the alarmist rhetoric and exposes the hypocracy.

View: https://youtu.be/fyiDwhbwxSs
Run time is 6:21

“What’s going on is cycles,” says Professor Plimer. “It’s normal to have cycles…. we are getting towards the end of a warm period. The peak of the warmth was about 5,000 years ago and we are headed for the next inevitable – inevitable! – ice age.”

“Now, I know it will be on a Tuesday, I just don’t know which Tuesday.”

“For you to think you can actually control what happens on the planet means you have an ego incommensurate with your knowledge.”

Every single ice age started when we had more CO2 in the atmosphere than we have now

What about carbon dioxide?

We’ve had six major ice ages interspersed with warming, says Plimer, and “every single ice age started when we had more carbon dioxide in the atmosphere than we have now.”

When it comes to today’s warmth, “to use the word ‘unprecedented’ shows that you have expunged history and geology from your knowledge. ”

“And to use the words ‘climate emergency’ indicates that you have absolutely no knowledge about the past.”

“Unprecedented now means it hasn’t happened in the last 20 years instead of the last 5,000 or 6,000 years,” laughs the host.
 

TxGal

Day by day
Major Winter Storm moving from Midwest to Mid-Atlantic to Northeast - 80 million people under watches - Ice Age Now

Major Winter Storm moving from Midwest to Mid-Atlantic to Northeast – 80 million people under watches
January 31, 2021 by Robert

Northeast bracing for a powerful Nor’easter that could dump up to two feet foot of snow in many areas, create blizzard-like conditions, bring down tree branches, and trigger widespread power outages.
________

Heavy snow and a wintry mix will produce hazardous travel from portions of the Great Lakes and Ohio Valley to the Mid-Atlantic, including the Washington D.C., Baltimore, Philadelphia, New York City and Boston areas. In the West, a series of systems will produce several days of lower elevation rain, heavy along the central West coast, and heavy mountain snow.

Major-Winter-Storm-31-Jan-21.png

Dark Blue, Pink and Purple indicate affected areas

In Chicago overnight there were reports of 1 inch of snow per hour snowfall rates.

As the storm moves eastward, New York, New Jersey and Connecticut could see heavy snow falling at the rate of one inch to 3 inches an hour tomorrow, continuing along the I-95 corridor throughout the day.

Much of the region could see blizzard-like conditions, with a foot to 18 inches – or even more – of snow.

Winter storm warnings were in effect Sunday from North Carolina to Pennsylvania and New Jersey. Winter storm watches remained in place for other parts of the Northeast and New England, including Boston.

Although higher elevations will suffer the heaviest snowfall totals, New York and Philadelphia have a good chance of seeing 6 to 12 inches of snow with Washington, D.C. and Boston looking at totals in the 3-inch to 6-inch range.

Snowfall, up to a foot, was forecast to start in Massachusetts on Monday morning and then head for northern New England later that night.

The “deep storm,” as the Weather Service puts it, will bring rain/freezing rain over parts of the Central Appalachians and the southern Mid-Atlantic, then move northeastward along the coast by Tuesday. Snow on the backside of the system will extend into the Southern Appalachians on Monday into Tuesday.

The snow will then move northward out of the Mid-Atlantic into parts of the Northeast and New England by Monday into Tuesday morning.

Meanwhile, multiple fronts will move into the Pacific Northwest today, moving inland to parts of the Northern Intermountain Region and Central California by Tuesday. Rain and some higher elevation snow will develop over parts of Northern California and the Pacific Northwest through early Tuesday.

By Tuesday morning snow levels will lower over the region, with snow advancing across the Cascades, Siskiyou, and Shasta Mountains. Additional snowfall of 1 to 2 feet is expected along the Cascades, with even more snow on top of the feet of snow that smothered California mountains last week.

WPC's Short Range Public Discussion

Major storm heads to Northeast after blanketing Midwest

Major winter storm moves from Midwest to East Coast to start week

https://www.accuweather.com/en/wint...ing-down-on-mid-atlantic-and-northeast/890164

80M people under watches, warnings, advisories as 'dangerous' snowstorm pounds Midwest, Northeast
 

TxGal

Day by day
Adapt 2030 has a new podcast out:

Is the Great Reset About A Cosmic Ray Burst Coming Toward Earth? - YouTube

Is the Great Reset About A Cosmic Ray Burst Coming Toward Earth?
7,384 views • Premiered 7 hours ago

View: https://youtu.be/Z5SDPNdMzaU
Run time is 16:09

Synopsis provided:

Through the last 3000 years, you can track rise and fall of civilizations by the cosmic ray density hitting the Earth. More cosmic rays, more clouds, and more difficult to grow food. We are about to receive high amounts of cosmic rays from 2021 forward, meaning global food production will decline, so is this the reason for the great reset. Elite trying to control a natural cycle.
 

TxGal

Day by day
The Oppenheimer Ranch Project has a new podcast out:

Blizzard To Bury Northeast In Feet Of Snow - Record Snow Predicted For PA - Silver Short Squeeze - YouTube

Blizzard To Bury Northeast In Feet Of Snow - Record Snow Predicted For PA - Silver Short Squeeze
2,755 views • Premiered 8 hours ago

View: https://youtu.be/4_NjMsSVV7A
Run time is 12:06

Synopsis provided:

80 Million people under winter storm watches and warnings http://bit.ly/2MK9QYJ
Blizzard to bury Northeast in feet of snow http://cbsn.ws/3r6Av0Y
Snowfall Projections Increase Again: Much Of Region Could Now See Between 18-24 Inches http://bit.ly/3oBV0RA
‘Major nor’easter’ will drop heavy snow in parts of Upstate NY http://bit.ly/3r9wCs9
As Nor'easter Nears, More Snow Is Expected, Blizzard-Like Conditions Are Possible http://bit.ly/39CHQQ5
SNOWFALL ANALYSIS FROM THE LAST 24 https://www.weather.gov/crh/snowfall
Prolonged Major Nor’Easter for the Northeast; More Heavy Rain and Snow in the West https://www.weather.gov/
GFS Model Total Snowfall US http://bit.ly/3ovGbzS
Magnitude 5.9 earthquake strikes near Boa Vista, Roraima, Guyana http://bit.ly/2NWTBsh
Worldwide Volcano News http://bit.ly/2v9JJhO
Planetary K-Index http://bit.ly/2keiUaE
8,000 year old engraving of Giraffes near Gobero - https://bit.ly/2YzSl09
and more
 

TxGal

Day by day
And another from Oppenheimer:

The Arctic Is In A Death Spiral? =NOT! The Arctic & Antarctic Ice Is Growing Based on Current Data - YouTube

The Arctic Is In A Death Spiral? =NOT! The Arctic & Antarctic Ice Is Growing Based on Current Data
3,464 views • Premiered 7 hours ago

View: https://youtu.be/8O2IXnJZYHo
Run time is 6:16

Synopsis provided:

The Arctic is in a death spiral. How much longer will it exist? http://bit.ly/3cuAgZE 28
Trillion Tonnes of Ice Have Melted Since 1994, on Track With Worst-Case Scenarios http://bit.ly/2MERLLY
CALIFORNIA SNOWSTORM: STALLED ATMOSPHERIC RIVER “ON STEROIDS” DELIVERS 4 FEET OF SNOW IN 24 HOURS https://bit.ly/3pB3gTf
UAH Global Temps https://bit.ly/3oipYhw
Total Snowmass Northern Hemisphere http://bit.ly/2lAFomU
Arctic Sea ice Thickness https://bit.ly/3oCIa5m
Antarctic Sea ice Data http://bit.ly/3tfzDZB
Understanding climate: Antarctic sea ice extent http://bit.ly/3tfzDZB
 

TxGal

Day by day
The Islands of Bermuda and Guam Break Low Temperature Records - Electroverse

bermuda_oli_2014291_lrg-3-e1612177359954.jpg


THE ISLANDS OF BERMUDA AND GUAM BREAK LOW TEMPERATURE RECORDS
FEBRUARY 1, 2021 CAP ALLON

Bermuda and Guam are islands separated by more than 14,000 km (8,700 miles), yet both suffered record cold over the weekend–a further indication of the global cooling we’re all now experiencing.

The British Overseas Territory of Bermuda, located in the North Atlantic, set a record low temperature on Saturday–one coming hot on the heels of last Thursday’s powerful winter storm, the island’s fiercest in a decade.

The Bermuda Weather Service (BWS) confirmed Saturday morning’s low.

“This morning’s minimum reached a very chilly 49.1F (9.5C),” said a BWS spokesperson. “This sets a new record low for the date surpassing the previous record of 51.4F (10.8C) back in 2005. Our unofficial wind chill measurement produced a ‘feels like temperature’ near 40F (4.4C). Brrrrr!”

View: https://twitter.com/bernewsdotcom/status/1355529004493713408


Thursday’s winter storm saw wind gusts of over 100 mph tear across the island for nine hours, knocking out power to several thousand homes.

GUAM

As historic winter storm “Orlena” began hitting the U.S. east coast, and while the Midwest was digging out from its own heavy dumping of snow, Guam –the unincorporated territory of the United States located in the Micronesia subregion of the western Pacific Ocean– suffered a severe blast of cold, at least by local standards.

As reported by guampdn.com, a 71-year-old cold record was busted during the early hours of Saturday morning when the mercury dipped to 69F (20.5C).

This reading is now Guam’s coldest temperature ever recorded on Jan. 30, beating out the 70F set back in 1950.

View: https://twitter.com/NWSGuam/status/1355598608209485830


“The 69 degrees recorded on Saturday was the lowest Guam temperature in 71 years,” said Landon Aydlett, warning coordination meteorologist with the National Weather Service Guam forecast office.

“We set a record for the day here on Guam … that broke a record for the day set way back in 1950 that was previously set at 70 degrees.

“[The cold] is going to last at least for another one to two months,” concluded Aydlett.

The COLD TIMES are returning, the mid-latitudes are REFREEZING in line with the great conjunction, historically low solar activity, cloud-nucleating Cosmic Rays, and a meridional jet stream flow (among other forcings).

Both NOAA and NASA appear to agree, if you read between the lines, with NOAA saying we’re entering a ‘full-blown’ Grand Solar Minimum in the late-2020s, and NASA seeing this upcoming solar cycle (25) as “the weakest of the past 200 years”, with the agency correlating previous solar shutdowns to prolonged periods of global cooling here.

Furthermore, we can’t ignore the slew of new scientific papers stating the immense impact The Beaufort Gyre could have on the Gulf Stream, and therefore the climate overall.


Prepare accordinglylearn the facts, relocate if need be, and grow your own.
 

TxGal

Day by day
Winter Storm "Orlena" is Pummeling Northeast with Historic Snowfall - Electroverse

snow-NYC-e1612172917491.jpg


WINTER STORM “ORLENA” IS PUMMELING NORTHEAST WITH HISTORIC SNOWFALL
FEBRUARY 1, 2021 CAP ALLON

A record-busting blizzard is currently blasting 20 U.S. states, leaving hundreds of thousands without power and sparking travel chaos.

Dangerous road conditions have been reported and state of emergencies declared as cities from DC to New York are starting to get pummeled.

Winter Storm Orlena watches and advisories are now in effect across 20 U.S. states, according to the NWS Prediction Center.

In New York, where over two feet of snow is expected, Mayor Bill de Blasio has declared a State of Emergency, restricting all non-essential travel after 6am on Monday.

View: https://twitter.com/NYCMayorCounsel/status/1356048067796070402


Monday is expected to deliver more snow to New York City than any single storm in at least 50 years, reports the nypost.com.

The monster snowstorm — dubbed “Orlena” by the Weather Channel — is forecast to dump 24+ inches of flakes on the Big Apple between Monday and Tuesday.

“By the time most people get up tomorrow morning, it will be snowing,” Accuweather senior meteorologist Dan Pydynowski told The Post.

“The snow will be light at first, so if people are waking up at 7 a.m. tomorrow, it won’t necessarily be snowing hard, but it will be snowing.”

The heaviest snowfall will hit from mid-morning on Monday into the evening, with the potential for flakes to come down at a rate of up to 3 inches per hour.

The mix of heavy snow and gusty winds could lead to blizzard conditions, experts said.


GFS Total Snowfall (inches) Feb 1 – Feb 16 [tropicaltidbits.com].

On average, Central Park sees more than 12 inches of snow in a single storm about once every four years, according to NWS statistics — the last storm to make a run at the 1-foot mark was a recently as December, 2020 when Winter Storm Gail delivered 11 inches to Central Park.

Storms that have dumped more than 20 inches of snow are much rarer, occurring just seven times since 1869. Back in 2016, Winter Storm “Jonas” (see featured image) delivered 27.5 inches to Central Park, marking the heaviest snowfall since record-keeping began in 1869.

This monster snowstorm will be followed by a descending blast of Arctic cold, forecast by the GFS to engulf much of North America starting around Feb. 5:


GFS 2m Temperature Anomalies (C) Feb. 6 to Feb. 8 [tropicaltidbits.com].

Stay tuned for updates.

The COLD TIMES are returning, the mid-latitudes are REFREEZING in line with the great conjunction, historically low solar activity, cloud-nucleating Cosmic Rays, and a meridional jet stream flow (among other forcings).

Both NOAA and NASA appear to agree, if you read between the lines, with NOAA saying we’re entering a ‘full-blown’ Grand Solar Minimum in the late-2020s, and NASA seeing this upcoming solar cycle (25) as “the weakest of the past 200 years”, with the agency correlating previous solar shutdowns to prolonged periods of global cooling here.

Furthermore, we can’t ignore the slew of new scientific papers stating the immense impact The Beaufort Gyre could have on the Gulf Stream, and therefore the climate overall.


Prepare accordinglylearn the facts, relocate if need be, and grow your own.
 

northern watch

TB Fanatic
Natgas Prices Jump 11% As Weather Models Point To "Widespread Cold"

BY TYLER DURDEN
ZERO HEDGE
MONDAY, FEB 01, 2021 - 22:20

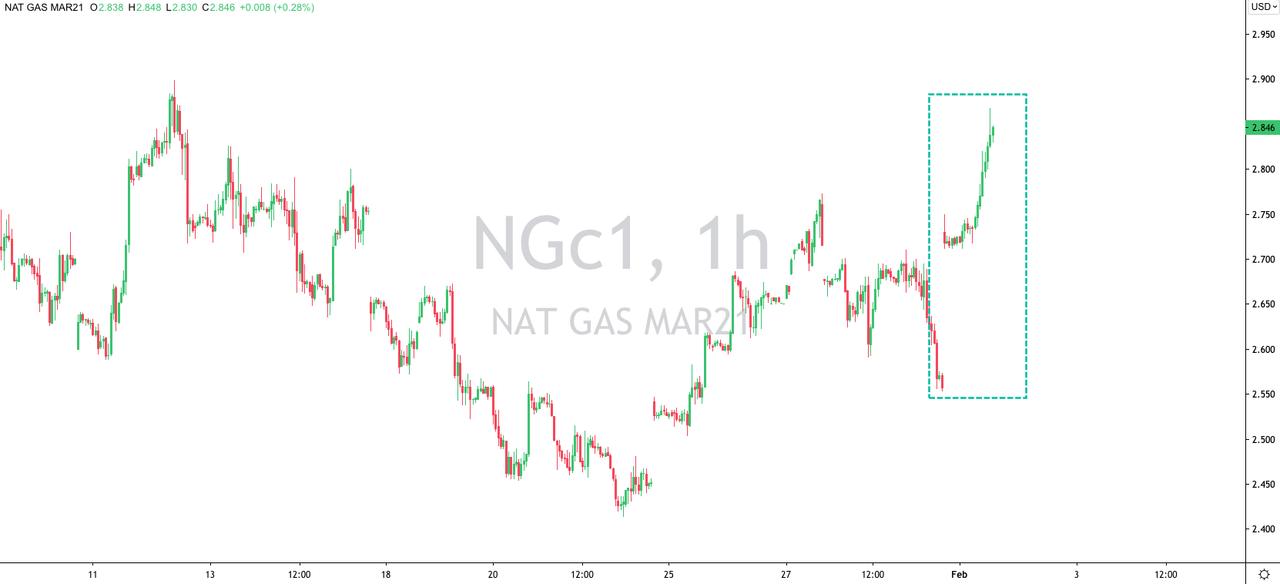
Natural-gas futures jumped 11% to 2.844 per million British thermal units on Monday afternoon after new forecasts suggest energy demand will increase in February as colder weather returns.

2021-02-01_13-41-27.png


"An unusually strong response to weekend adjustments to the short-term temperature forecasts," said Ritterbusch and Associates. The independent consulting firm said prices could reach the $3 mark by the end of the month.

BAMWX's meteorologist Kirk Hinz tweeted, "If you're a fan of cold & wintry weather ahead, this pattern is for you." He said a polar vortex is pouring Arctic air into the US's central part that will "help transition out of the previously warm pattern."

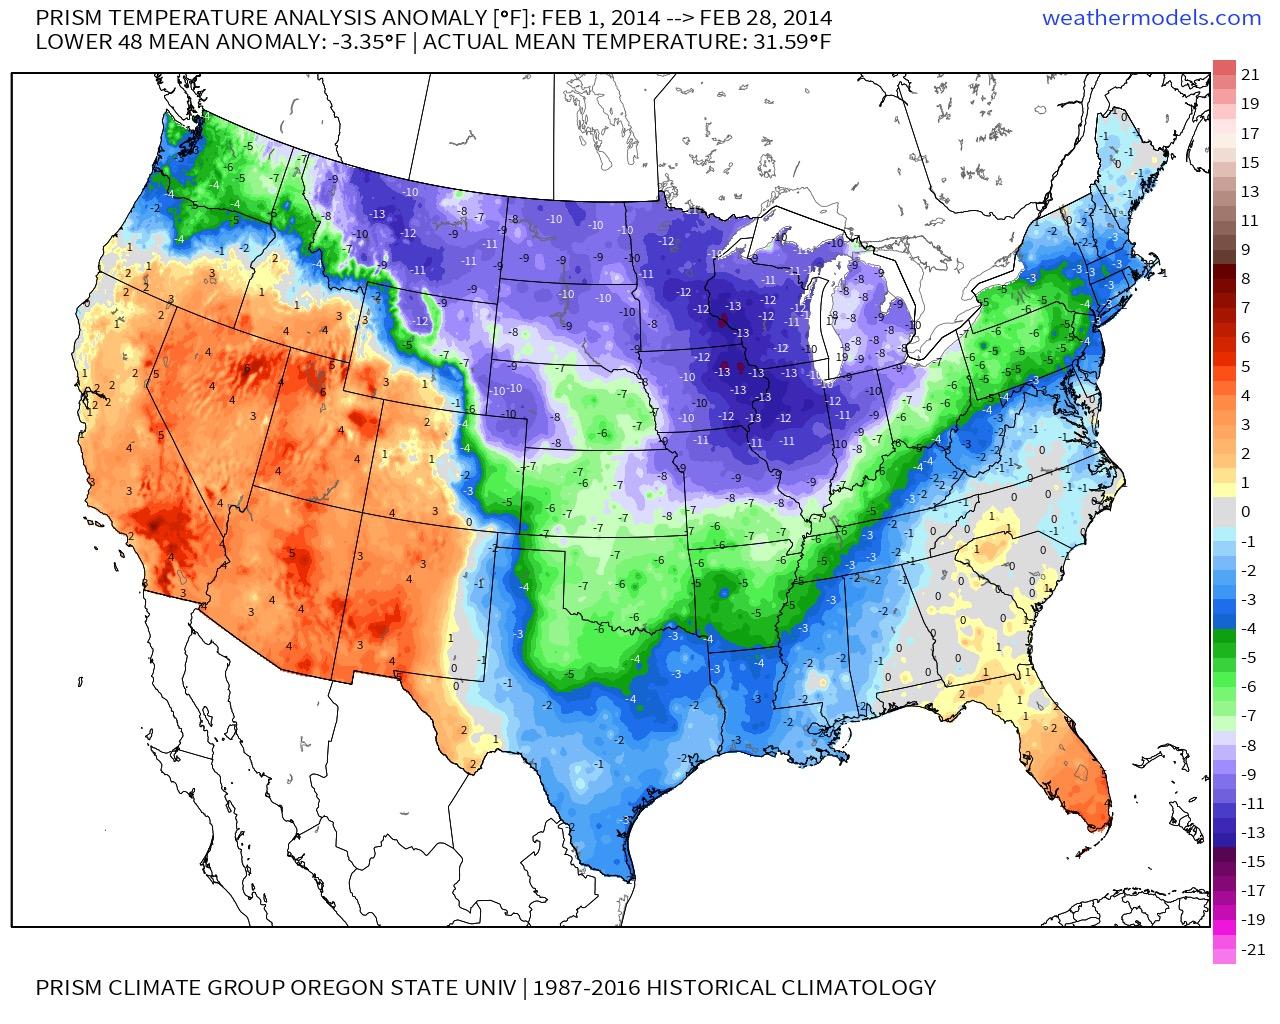
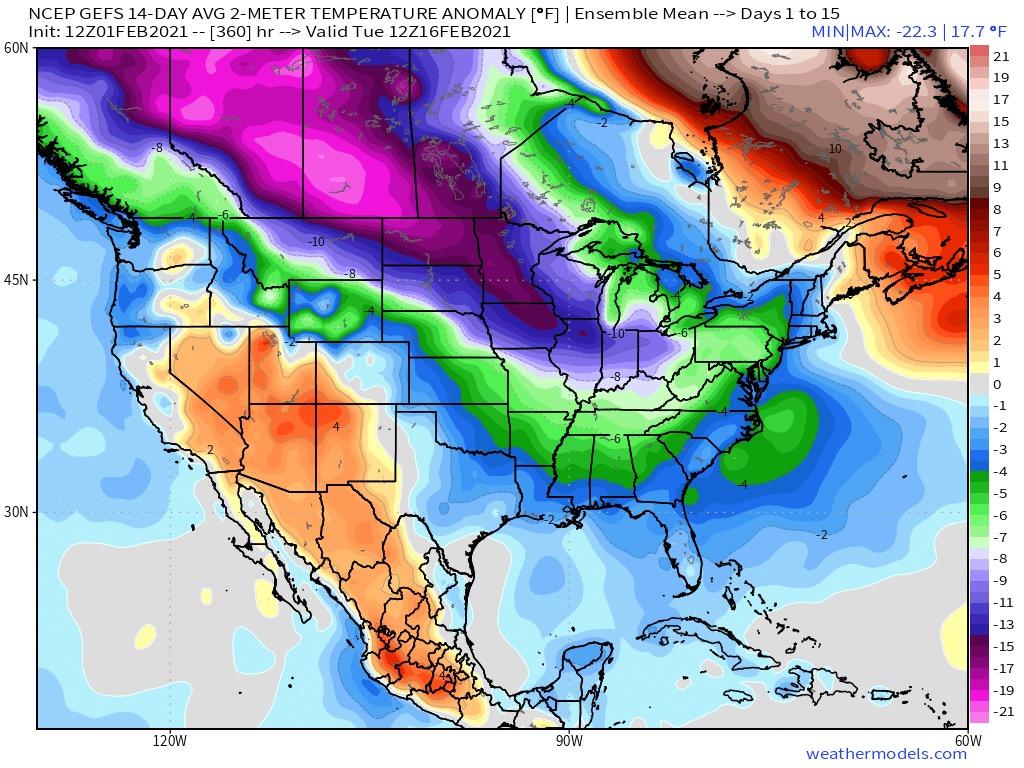
"The pattern ahead as we get deeper into mid-February supports a widespread colder than normal look across the US we haven't seen since February 2014. A combination of finally tapping into the Polar Vortex and favorable atmospheric tropical forcing has data showing some of the coldest air on the Planet pushing South into the US, starting next week," Hinz stated.
February 2014 Reference


prism_conus_tavg_anom_FEB2014.jpeg


Next Two Weeks

gefs_t2ma_d14_f_conus_360.jpeg
"I can't really recall a time where I've witnessed a 32 heating degree days gain inside of 11 days on the ensemble runs," he said. Rising heating degree days means natgas demand is set to increase.

hdd.jpg


He concludes by saying both "GFS & ECMWF" could bring "absolute brutal cold next weekend behind a winter storm."
... and just in time as Goldman Sachs flipped from bearish to bullish on natgas.

To sum up, natgas prices are exploding higher on a weather outlook that is much colder than previously expected. There's also a threat of another system next weekend.

Natgas Prices Jump 11% As Weather Models Point To "Widespread Cold" | ZeroHedge
 
Last edited:

TxGal

Day by day
Philadelphia, New York City and Boston brace for record snowfall - Ice Age Now

Philadelphia, New York City and Boston brace for record snowfall
February 1, 2021 by Robert

One of the biggest winter storms in years is slamming the East Coast. Snow could pile up 2 feet (60 cm) in some areas. Near blizzard conditions very likely. Officials preparing for widespread power outages. Hundreds of flights canceled.

A powerful Nor’easter and winter storm will pound much of the Northeast and New England today and Tuesday with a variety of hazards, according to the National Weather Service. More than 70 million people across 17 states are hunkering down in its path.

Widespread heavy snow, gusty winds, near blizzard conditions and coastal impacts are very likely.

Expect major to extreme impacts across the region from Washington, D.C. to Pennsylvania to New Jersey to Maine, including the Philadelphia, New York, and Boston metro areas.

The National Weather Service warned that travel in New York City, where 20 inches of snow was expected, will become “very difficult to impossible,” and that the storm will cause travel problems for days. Boston could be hit by up to 16 inches of snow today alone, the National Weather Service warns.

Maximum storm snowfall totals are now a foot – or more – from eastern Pennsylvania to northern New Jersey and western Long Island, according to weather.com. The highest total as of 12 p.m. EST was 16 inches in Longhill Township, New Jersey.
New York’s LaGuardia Airport had 9 inches of snow on the ground as of 12 p.m. EST, with snowfall rates of an inch per hour.

On Monday evening, the heavy snow will expand from parts of the Mid-Atlantic into Northern New England and continue over parts of the Northeast into Wednesday.

Overnight Monday, the snow will begin to weaken over the Ohio Valley into parts of the Southern Appalachians. However, the snow will linger over the Central Appalachians into Wednesday morning.

In the meantime, a front approaching the Northwest will advance eastward to the Northern Intermountain Region/Northern Rockies to Southern California by Wednesday. The system will produce rain and some high elevation snow over parts of the Pacific Northwest and parts of Northern California on Monday.

When the front moves onshore overnight Monday, snow levels will lower over the region. On Tuesday afternoon, snow returns to California’s higher elevations and into parts of the Northern Intermountain Region. By Wednesday morning, the snow will move into parts of the Northern Rockies.

Winter Storm Orlena Winding Down Over the Northeast With Snow, Gusty Winds | The Weather Channel - Articles from The Weather Channel | weather.com

WPC's Short Range Public Discussion

National Weather Service

Heavy Snowfall in Northeast Disrupts Travel and Vaccine Rollout

Video:
Brutal winter storm slams Northeast

Possible historic snow in New York City. Video:
Major storm hits Northeast with possible historic snow in NYC
 

TxGal

Day by day
Part 1 of 2:

33 Simple Bullet Points proving 'Global Warming' is caused by the Sun, not CO2 - by a geologist - Electroverse

AGW-fraud-2-e1612257853407.jpg


33 SIMPLE BULLET POINTS PROVING ‘GLOBAL WARMING’ IS CAUSED BY THE SUN, NOT CO2 — BY A GEOLOGIST
FEBRUARY 2, 2021 CAP ALLON

Dr Roger Higgs (DPhil geology, Oxford, 1982-86)
Geoclastica Ltd and ResearchGate

Abbreviations:

‘AD’ = anno Domini
‘BC’ = years ‘before Christ’
‘BP’ = years ‘before present’, from radiocarbon dating. 0 is 1950AD by convention
~ = about/approximately

1) The IPCC (United Nations Intergovernmental Panel on Climate Change) has no geologists among the hundreds of authors of its last major report (2013-14) and at most 1 geologist in the next report (due 2022; see my Technical Note 2019-10). Thus IPCC focuses on only the last 170 years (since multiple reliable thermometer measurements began, ~1850), yet Earth is 26 million (sic) times older, 4.5 billion years. Geologists know that throughout this time Earth has constantly warmed or cooled (never static). Thus ‘climate change’ is nothing new; it is perfectly usual. During the last 11,650 years, our current ‘Holocene’ interglacial epoch, climate change has repeatedly been fast enough to cause collapse of civilisations (Bullet 20).

2A) The IPCC’s very existence relies on public belief in ‘Anthropogenic (man-made) Global Warming’ (AGW) by CO2 emissions. Most IPCC authors, mainly government and university researchers, are biased by strong vested interests in AGW (publications; continuance of salaries; research grants).

2B) Similarly, universities have sacrificed their impartiality by hosting institutes financially mandated to promote AGW. For example, London’s former bastion of scientific integrity Imperial College has, since 2007, housed the ‘Grantham Institute – Climate Change and the Environment’, founded and funded by investment magnate Jeremy Grantham (heavily involved in forest destruction for biomass energy according to the 2019 Michael Moore/Jeff Gibbs documentary ‘Planet of the Humans’). The ‘Tyndall Centre for Climate Research’ (founded 2000) has branches at the Universities of Cardiff, Manchester, Newcastle and Fudan, and also at the University of East Anglia, in the same building as the infamous IPCC-linked Climatic Research Unit (CRU; Wiki ‘Climategate’).

2C) Well-known scientists formerly associated with the IPCC have subsequently denounced its methods.
3) Claimed ‘97% consensus among scientists’ that AGW exists is a deception. It refers in fact to polls of recent publications by only ‘climate scientists’, i.e. atmospheric specialists, lacking deep-time perspective (Bullet 1), who deal with ‘climate models’ (Bullet 6). Graduation and employment of ‘climate scientists’ opportunistically boomed in the AGW hysteria since 1990, lavishly funded, creating a strong incentive for bias (Bullet 2). The vast majority of the world’s normal scientists, numbering millions and lacking any financial bias, are not part of the ‘consensus’, having never been polled, myself included. In November 2019 Wikipedia deleted its “List of scientists who disagree with the scientific consensus on global warming” (Bullet 29).

4) No informed person ‘denies’ global warming: it has been measured (Bullet 11). ‘Global-warming denier’ is a deceitful term, with intentionally despicable connotations, for doubters and deniers of ‘Anthropogenic (man-made) Global Warming’ (AGW), probably the majority of the world’s scientists.

5A) The “greenhouse effect … a slight misnomer” (Wiki; in fact a complete misnomer; see their references) … “is the process by which radiation from a planet’s atmosphere warms the planet’s surface” (Wiki, citing IPCC). This bold claim that Earth’s land- and ocean surfaces are warmed by the air is ‘backwards’. In truth the (solar-warmed) ocean warms the atmosphere, as shown by two observations: (1) ocean-surface water (covering ~70% of Earth) is almost everywhere warmer (fractionally) than the air above it; and (2) changes in global average surface air temperature lag 1 to 1.5 months behind corresponding changes in global sea-surface temperature. These two facts indicate that heat (only capable of flowing one way, from warmer to cooler) flows outward, from the ocean to the air, not vice versa. A truthful summary of the greenhouse effect is that solar energy absorbed at Earth’s surface is radiated back into the atmosphere as heat, some of which is absorbed on its way out to space by greenhouse gases. Thus greenhouse gases cause no warming; instead they reduce the air’s heat loss to space.

5B) CO2 is a ‘greenhouse gas’ (GHG). Due to the ‘saturation effect’, CO2’s theoretical heat-trapping ability sharply (logarithmically) declines as its concentration rises. CO2’s Climate Sensitivity (CS) is the hypothetical warming due to a doubling of CO2. IPCC ‘estimates’ CS, based on defective (Bullet 6) climate models (circular reasoning), as probably between 1.5 and 4.5C°, a 300% contrast! According to a landmark new paper by van Wijngaarden & Happer (2020), CS for doubling from 400 to 800ppm is theoretically 1.4 to 2.3C°, but their calculations assume cloud-free conditions; the effect of clouds, which cover about two-thirds of Earth at any moment (Wiki ‘Cloud cover’), is very uncertain (Bullet 5C).
5C) Despite CO2’s greenhouse-warming potential, evidently the Sun (not CO2) governed our climate for at least the last 2,000 years, based on good correlation between solar-magnetic output (SMO) and Earth’s average surface temperature (Bullet 12), in contrast to CO2’s non-correlation (Bullet 12B) except the partial coincidence (by chance) of its strong rise since 1850 (start of Industrial Revolution) versus ‘Modern Warming’ (1815 to present-day; Bullet 11) and SMO’s ~1700-1991 surge. This proves that CO2’s greenhouse-warming potential, already fallen logarithmically “well into the saturation regime”, is negated by feedbacks. Two natural feedbacks ignored in IPCC climate models are: (i) little known cloud feedback; and (ii) “potentially very important” increased biogenic ‘BVOC’ aerosol due to faster forest growth by warming & CO2 fertilization. (The only feedbacks listed in IPCC’s influential 2013 Fifth Assessment Report figure SPM.5 are man-made ones’, with very wide “uncertainty intervals”.) IPCC admits “aerosols and their interactions with clouds have offset a substantial portion of global mean forcing from … greenhouse gases. They … contribute the largest uncertainty”; and “quantification of cloud and convective effects in models, and of aerosol–cloud interactions, continues to be a challenge.” IPCC’s underestimation of negative feedbacks explains why climate models run too hot (Bullet 6), and why ‘runaway’ warming has apparently never occurred on Earth.

6A) Computer ‘climate models’ (by ‘climate scientists’; Bullet 3) are so full of assumptions (stacked upon other assumptions) as to be highly misleading at best, e.g. 1985-2015 warming forecast by 31 models turned out 2 to 4 times too high. Even pro-IPCC ‘tricky Wiki’ (Bullet 29) admitted: “Each model simulation has a different guess at processes that scientist don’t understand sufficiently well”. 6B) Climate models ignore three crucial factors: (i) natural cloud and aerosol-cloud feedbacks (Bullet 5D); (ii) large changes in solar magnetic output (SMO; Bullet 12A), driving global temperature changes according to the Svensmark Theory, denied by the IPCC (Bullet 14), which disingenuously says ‘total solar irradiance’ (TSI; varies in step with SMO but proportionally far less) varies much too little to affect climate, so CO2 must be in charge; likewise the CRU (Bullet 2B); and NASA, which went so far as to publish ‘Atmospheric CO2: Principal Control Knob Governing Earth’s Temperature’ in 2010; (iii) ‘ocean-lag’, the multi-decade delay between changes in SMO and correlative changes in temperature (Bullet 21). These three IPCC failings, ‘Sun denial’, ocean-lag omission, and feedback underestimation, render climate modelling conducted to date worthless.

7A) For much of the last 550 million years (Phanerozoic time), atmospheric CO2 was 2 to 10 times higher than now. Evolution flourished. Plant photosynthesis, the basis of all life, was stimulated by higher CO2 (Bullet 8). Extinction events due to overheating by CO2 are unknown.

7B) Throughout Phanerozoic time, CO2 seemingly correlated well with temperature (although all studies inevitably have low resolution). This is readily explained by warming oceans releasing CO2 and vice versa (Bullets 9, 10).

8A) Through Holocene time, atmospheric CO2 was a mere 250-285 ppm (i.e. near plant-starvation level of ~150 ppm; Wiki ‘CO2 fertilization effect’; also Bullet 27), until ~1850 when mankind’s industrial CO2 emissions began. Since then, atmospheric CO2 has climbed steeply. Proving that man’s emissions are the main driver of this post-1850 rise in CO2, ice cores show that the last five interglacial periods (including the Holocene) all reached levels of 250-300 ppm, i.e. a sort of ‘equilibrium’ value. CO2 today (January 2021), 415 ppm, is still only 0.04% of our atmosphere (i.e. less than half of one-tenth of 1%), far less than in the past (Bullet 7).

8B) The present CO2 level of 4165ppm is far from hazardous to human health, e.g. CO2 levels in American Navy submarines typically average 3,000-4,000ppm with no reported ill effects. Benefits of rising CO2, thanks to the ‘CO2 fertilization effect’, include expansion of natural forests (‘greening’ of the planet) and increased agricultural productivity, essential for feeding Earth’s burgeoning population. Thus, ironically, man’s production of CO2 by burning fossil fuels (for energy and transport) has unintentionally averted, or at least postponed, a global food crisis. Commercial growers inject CO2 into their greenhouses. “CO2 enrichment in greenhouses allows crops to meet there (sic) photosynthesis potential.” “For most crops the saturation point will be reached at about 1,000–1,300 ppm … Increased CO2 levels will shorten the growing period (5%–10%), improve crop quality and yield”.

9) Until man began adding industrial CO2 about 1850, global warming (determined from ‘proxies’ like tree rings) since the ~1815 cold peak of the Little Ice Age (~1250-1920) was accompanied by a very slight rise in CO2 (measured in ice cores). A simple explanation is the well-known release of CO2 by warming ocean water (decreasing its CO2-holding capacity).
10) Other evidence, besides Bullet 9, that rising CO2 is a consequence, not cause, of global warming is that Quaternary glacial-interglacial temperature changes were followed “very closely” by changes in CO2. Based on ice-core data, the time-lag is somewhere between 400 years and zero, possibly even slightly negative. However, based on direct thermometer and CO2 measurements covering the last few decades, changes in CO2 lag behind ~5 months according to Kuo et al. (1990) and 11-12 months according to Humlum et al. (2013).

11) Thermometer records since 1750 show 2.1C° warming (global land average) since 1815 (Little Ice Age nadir; Bullet 9). This ‘Modern Warming’ (name proposed here) was interrupted by two 30-year coolings (1880-1910, 1945-1975, 0.2C° each) and the 1998-2013 ‘Global warming hiatus’ (Wiki); and by frequent brief (1-3 years) minor coolings, some attributable to mega-volcano ‘winters’ (1-10years) and perhaps to El Niño/La Niña events (seldom if ever exceed 2 years). After the first 30-year cooling, global average warming was 1.3C° from 1910 to 2016 (slight cooling since then [Bullet 13]). In contrast, since the start of industrial CO2 additions ~1850 (Bullet 8), CO2’s rise has accelerated, with only a brief pause (1887-97) and a mini-reversal (1940-45), both during the 30-year coolings, and both attributable to CO2’s increasing solubility in a cooling ocean (Bullet 9). The 30-year coolings match solar-output downturns, after applying a temperature lag of ~100 years due to ‘ocean memory’ (Bullet 21). There is no other viable explanation.

12A) This unsteady ‘sawtooth’ (up-down) style of post-1815 ‘Modern Warming’ (Bullet 11) mimics the sawtooth rise in solar-magnetic output (SMO) from ~1700 (end of sunspot-defined ‘Maunder Minimum’) to 1991 (peak of Sun’s modern ‘Grand Maximum’ [GM; 1937-2004]). A good cross-match is obtained by applying a temperature delay of ~100 years (‘ocean-lag’; Bullet 21), thereby aligning the two 30-year coolings (Bullet 11) with two solar declines. SMO’s ~1700-1991 surge was both the strongest (amplitude) and highest in at least 9,000 years, increasing 350% from 1700 to 1950 and, in the 20th Century alone, 131% from 1901 to 1991, and 41% from 1964 to 1996. “The last period which showed similar high activity and also lasted as long as the current one was about 1700 years ago” (Steinhilber et al. 2008). That particular ~300AD GM caused warming (and drove a global 2-3m sea-level rise, the ‘Romano-British Transgression’, portending another such rise imminently (Bullet 24). Thus I propose that the Sun drove Modern Warming (via the Svensmark cosmic ray/cloud mechanism [Bullet 14]), with negligible or no help from CO2, in the same way that earlier (lesser) GMs of the last 8,000 years clearly correlate with (lesser) warmings (Bullet 12B).

12B) Similarly, since at least 2,000 years ago, solar-magnetic output (SMO) correlates well with temperature (proxy temperatures from tree rings, ice cores, etc. in the pre-thermometer era before 1750). Both graphs have a hockey-stick shape (Bullet 32): the ‘shaft’ is an overall ~1,200-year decline from ~400AD to the Little Ice Age (LIA; Bullet 9), with superimposed 50-200-yr smaller up-down ‘sawteeth’; the ‘blade’ is the post-1700 surge (Bullet 12A). Applying a temperature lag of ~100-150 years (Bullet 21) aligns: (i) the Sun’s ~300AD GM (Bullet 12A) and the ~450AD highest temperature of the last 2,000 years (possibly surpassed by Modern Warming); and (ii) the ~1700 LIA solar minimum and the 1815 LIA minimum temperature (Bullet 12A). Moreover, the graphs have the same proportionality: ~3:2 ratio of surge height versus sawtooth amplitude; and ~1:1 height ratio of the shaft and blade. In contrast, CO2’s correlation with temperature for the last 2,000 years is very poor: the only (partial) match is CO2’s surge since ~1850 (start of Industrial Revolution). CO2 mismatches are: (i) slight overall rise from 500AD into the LIA (i.e. ‘shaft’ gradient is backwards); (ii) sawteeth are minuscule; and (iii) the two 30-year solar- and temperature declines (Bullet 12A) are missing. Further back in time, despite decreasing proxy availability and looser dating, correlation is also evident for at least the last 8,000 years, superimposed on long-term slight cooling due to Earth’s declining axial obliquity since ~8,500BP (google Milankovitch orbital forcing).

13) 2016 was the warmest year ‘since records began’, i.e. only since ~1850, when a reliable global thermometer network existed. 2017, 2018 and 2019 were all cooler. (NB no volcanic mega-eruption since 1991). Yet CO2 is still rising. So every passing day that isn’t ‘warmest ever recorded’ for that date at multiple sites worldwide is awkward for the IPCC.

14) The breathtakingly elegant and simple ‘Svensmark Theory’ says rising solar-magnetic output, by deflecting more cosmic rays, reduces cloudiness. This allows more of the Sun’s warmth to heat the ocean and hence the atmosphere (Bullet 5A), instead of being reflected back out into space by clouds. In support, a NASA study of satellite data spanning 1979-2011 (during the ‘Modern Warming’; Bullet 12) showed decreasing cloud cover. The IPCC dismisses Svensmark’s theory.

15) Vocal climate scientist, computer modeller, IPCC lead author, and recipient of a 1999 US$1 million private donation to work on his alarming idea that man-made warming might stop “Atlantic conveyor belt” ocean circulation, with dire consequences for regional climate (cooling), ecosystems and society, Stefan Rahmstorf (Wiki) of the Potsdam Institute for Climate Impact Research wrongly said in 2008: “there is no viable alternative … [to CO2 as driver of 1940-2005 warming, as] … different authors agree that solar activity did not significantly increase”. Yet in 1999, physicist Dr Michael Lockwood FRS (Wiki) and co-authors wrote in prestigious Nature journal that from 1964 to 1996 “the total magnetic flux leaving the Sun has risen !p.!6!of!9!by a factor of 1.4” and from 1901 to 1992 by 2.3! Supporting Lockwood’s work, Steinhilber et al. (2010) showed that “Since the year 1700, the open solar magnetic flux has increased by about 350%”.
 

TxGal

Day by day
Part 2:

16) Lockwood (Bullet 15) showed that averaged solar magnetic flux increased 230% from 1901 to 1995, i.e. more than doubled. The ongoing (ocean-lagged) warming that followed the 1945-75 cooling (Bullet 5) was driven by this solar surge, via the Svensmark effect (Bullet 14), delayed by ‘ocean memory’ (Bullet 21), which will ensure continued warming for several more decades. Bullets 17 and 18 also support Svensmark’s theory.

17) After the ~300AD solar Grand Maximum (Bullet 12), between 350 and 450 global average temperature warmed to near today’s value. Subsequent ‘sawtooth’ cooling mimicked the Sun’s 1,000-year sawtooth decline into the Little Ice Age (Bullet 9).

18) In the ‘Holocene Climatic Optimum’ (Bullet 20) spanning 8,000 to 2,000BC, Earth was warmer than now except for about five interludes of a few decades each. Unsteady cooling from 3,000BC to the Little Ice Age (Bullet 9) paralleled unsteady solar decline.

19) This 4,500-year-long cooling mocks IPCC computer models that instead predict warming by the simultaneous (slow) rise in CO2. This is the ‘The Holocene Temperature Conundrum’ of Liu et al. (2014). See also Bullet 6.

20) Embarrassingly for the IPCC, the 8000-2000BC warm interval (Bullet 18) was already called the ‘Holocene Climatic Optimum’ (Wiki) before IPCC’s ‘CO2 = pollutant’ fallacy induced today’s AGW hysteria and pointless multi-trillion-dollar climate-change industry. The warmth may have benefited development of human civilisations.

21) For at least the last 1,700 years, sawtooth-style global warming/cooling correlate well with solar-magnetic activity (Bullet 12) by applying an ‘ocean-memory’ lag of 60-160 years (varying with time), attributable to oceanic thermal inertia (vast ocean volume, high heat capacity and slow circulation/mixing; Bullet 6), causing delayed response to changes in solar-magnetic flux, hence cloudiness, which governs global temperature (Bullet 14).

22) The IPCC says ongoing global warming despite solar weakening (since 1991; Bullet 12) disqualifies the Sun as the cause of warming. This disingenuously ignores the time-lag caused by oceanic thermal inertia, of which the IPCC is well aware, and which brings the Sun’s past ‘ups-and-downs’ (‘sawteeth’) into alignment with global temperature ups-and-downs (Bullet 12). Thus one of only three pillars upon which the ‘Anthropogenic (man-made) Global Warming’ dogma stands is demolished. The other two, namely (i) simultaneous warming and acceleration in CO2 since 1850 (a chance coincidence; Bullet 24), and (ii) the 30cm sea-level rise since 1850 supposedly unprecedented in 2,000 years (Bullet 26), are equally easy to dismiss.

23) The last interglacial period, ~120,000 years ago, was warmer than our Holocene interglacial. Humans and polar bears survived! CO2 was then about 275 ppm, i.e. lower than now (Bullet 8), at a time of greater warmth!

24) The joint rise of temperature and CO2 is a ‘spurious correlation’, mere chance. Earth’s temperature correlates much better with solar output, which increased just as impressively in the 20th Century (Bullet 12). So IPCC’s demonising of CO2 as a ‘pollutant’ is a colossal blunder, costing trillions of dollars in needless and ineffectual efforts to reduce it. Instead, governments need to focus urgently on the imminent metre-scale Sun-driven sea level rise.

25) Although the Sun is now declining since its 1991 magnetic peak (Bullet 12), solar-driven global warming will continue until ~2050 due to ‘ocean-lag’, presently ~60 years (Bullet 21). Meanwhile rising CO2 will continue to raise global food production (Bullet 8), without affecting climate (Bullet 5). Cooling will begin ~2050 and last at least 28 years (i.e. post-1991 solar-magnetic decline to date). Sadly our benign Holocene ‘interglacial’ period will eventually end, inevitably, by Milankovitch orbital forcing (Bullet 12), much more powerful than solar changes.

26) IPCC says sea level (SL) from 0 to 1800AD varied < 25 centimetres (and < 1 metre since 4000BC) and never exceeded today’s SL, therefore the 30-centimetre SL rise measured since 1850 is abnormal, they say, blaming industrial CO2. But this claim, based on flawed cherry-picked evidence, ignores dozens of studies of geological and archaeological 3000BC-1000AD SL benchmarks globally, which reveal 3 or 4 rises (and falls) of 1-3 metres in < 200 years each (i.e. > 5 millimetres/year), all reaching higher than today, long before industrial CO2.

27) If humans were to stop expanding fossil-fuel use and maintain current levels, CO2 would soon stabilise at a new equilibrium value, nearer the optimum for plants (Bullet 8). When fossil fuels eventually become too scarce to produce economically, and we switch inevitably to nuclear energy, CO2 will decrease.

28) NASA’s ‘ClimateKids’ website says “Extra greenhouse gases in our atmosphere are the main reason that Earth is getting warmer” and “today the planet is warming much faster than it has over human history.” The first statement is untrue (see many Bullets above). The wording of the second statement, which may or not be true, gives the impression that man is to blame, and omits to mention that the Sun’s increase in output from the Little Ice Age (Bullet 9) to the 1991 solar-magnetic peak was the greatest for at least the last 9,000 years (Bullet 12). Society is in a sad state when even NASA, who put men on the moon, is reduced to uncritically jumping on the AGW bandwagon/gravy train and scaring children with a fairy tale (i.e. first statement above) affecting their mental health (see also Bullet 8).

29) In March 2020 I exposed Wikipedia’s November 2019 deletion of its ‘List of scientists who disagree with the scientific consensus on global warming’ (Bullet 4), which named 79 renowned PhD scientists (each with his/her own Wikipedia entry), from diverse sciences, brave enough to publicly challenge the global CO2 madness. (Tens of thousands of other ‘skeptical’ scientists are sadly too timid to join in, frightened for their jobs.) Thus, your children may never know that many prominent, impartial scientists disagree with the claim by the under-qualified (Bullet 1), disingenuous (Bullets 6, 22) IPCC that global warming is due to man-made CO2. This is global censorship by ‘Tricky Wiki’. Fortunately the list survives, both hard-copy (contact me for pdf) and online (for now).

30) Dismissing Modern Warming’s clear correlation with 20th-century rising solar activity based on sunspots (especially after applying a time-lag of ~60-100 years; Bullets 12, 21), the Royal Observatory of Belgium’s SILSO group (connections to IPCC) produced a “corrected” new sunspot series, now widely accepted, greatly inflating the 1778 sunspot peak, so that the 1958 peak (Bullet 12) looks much less exceptional. The result was announced in a 2015 press release by SILSO Director Frédéric Clette: “The new record has no significant long-term upward trend in solar activity since 1700, as was previously indicated. This suggests that rising global temperatures since the industrial revolution cannot be attributed to increased solar activity.” Voilà ! How pleased must the IPCC have been? My Technical Note 2019-17 shows the “correction” to be incorrect.

31) The NASA and HadCRUT graphs (Bullet 11) show global land surface air temperature rising faster than sea surface temperature since 1985. Land and sea warming from 1985 to 2016 was supposedly 1.2 and 0.5 centigrade degrees, respectively (NASA), i.e. the land warmed more than twice as fast! This divergence is highly doubtful, for two reasons: (1) the same graphs show much less divergence before 1985 and sometimes in the opposite sense; and (2) the ocean governs global average air temperature (Bullet 5A), therefore how can the latter warm more than the former? Computer models blame the divergence on global warming by CO2, but models can produce any desired result (Bullet 6). A far more likely explanation is inadequate land-temperature correction for the ‘urban heat island’ effect. Indeed, there has been massive urbanisation worldwide since 1985, out-of-control world population increasing 60% and urban population more than doubling.

32) The ‘Hockey stick controversy’ (Wiki) refers to Michael Mann’s 1999 temperature graph for 1000AD to 1998, shaped like a hockey stick, with its ‘shaft’ and ‘blade’ joining at the Little Ice Age (Bullet 9). Many AGW skeptics and deniers (Bullet 4) accused Mann of fraudulently erasing the warm ‘hump’ of the Medieval Warm Period (MWP) in the previously accepted temperature graph for 900 to 1950AD by pioneer palaeoclimatologist and originator of the MWP concept Hubert Lamb (1965), re-published with minor alterations by IPCC itself (Folland et al. 1990), showing the MWP peak ~1150AD, and warmer than today. But Lamb’s graph was only intended as a gross approximation, based mostly on historical documents. In contrast, post-1999 graphs based (like Mann’s) on temperature proxies (tree rings etc.) and extending further back to 1AD, vindicated Mann and confirmed the MWP hump was lower and broader, and started centuries earlier, and was already surpassed by Modern Warming by 2000 or possibly as early as 1950.

33) The IPCC assures us that Earth’s temperature is controlled by CO2 and that the Sun has minuscule or zero effect. This is precisely backwards. In truth, solar-magnetic output controls our climate (Svensmark effect, Bullet 14) and CO2 has little or no influence (Bullets 1, 10, 11, 19, 32). Varying solar output even controls the timing of large earthquakes, making it even harder to believe the IPCC’s claim that the Sun might not affect climate.

CONCLUSION

These 33 bullets collectively prove that any CO2 effect on global temperatures of the Holocene period (i.e. the last 11,650 years), including the ‘Modern Warming’ period since 1815, was nil or too small to detect. Almost certainly CO2’s greenhouse effect is nullified by negative-feedback effects greatly underestimated by the IPCC. This explains ‘The Holocene Temperature Conundrum’ and why ‘runaway’ warming is unknown throughout geological history. Holocene temperature changes were instead driven by solar-magnetic changes (controlling cloudiness via the Svensmark Theory), superimposed on long-term cooling due to Earth’s declining axial obliquity.

I, Dr Higgs, predict another few decades (to about 2050) of ocean-lagged Modern Warming by the Sun’s 20th-century surge, offset by CO2’s net (including feedbacks) cooling effect, while CO2 climbs nearer the optimum for plant photosynthesis. Then Sun-forced cooling will begin. There is no ‘climate emergency’. There has never been a better time to be alive. Be happy.

Dr Roger Higgs (DPhil geology, Oxford, 1982-86)
Geoclastica Ltd and ResearchGate
 

Martinhouse

Deceased
TxGal, the worst of the weather has pretty much missed me right here. It's a good deal colder here now, than down there where you are, where you are, but the awful weather has mostly skimmed past me to the north and a couple of times to the south.

Guess I haven't posted much lately because there's not much left to say. As far as the regular news goes, like what I find on the main page here now, is just more and more of the depressing sameness we all knew would happen after the inauguration, The only thing that really makes an impression on me any more is the horrible weather happening all over the world and it seems to have gotten worse even faster than I was expecfting.

February is usually worse than January here where I am (supposed to get down into the teens this coming Saturday and Sunday) and so I'm just trying to stay warm and hope I see signs of spring soon, Like the jonquils blooming on south-facing banks by Valentine Day, and when the roosters start their big-time crowing and fighting over the hens. (I am hoping to get my new roosters tomorrow.....I'll have to call the lady who's got them and see if she's been able to catch them yet.)

My biggest hope is that there will be an actual summer so I can have at least a little bit of a garden.
 

TxGal

Day by day
Glad you're doing okay! Really glad the worst of the weather has passed you by! We've been warmer the last few days and just busting outside getting stuff done (and of course at our age we stiffen up something terrible in the evening, but keep plugging along). We're going to get that artic blast coming down on the weekend, so we're doing what we can in between cold spells.

The early signs of spring are here. We can see the beginnings of buds on the trees, both on our place and way off in the distance...they kind of start getting a red tint toward the tops of the heavily-forested areas that we look for every early spring. Grass is just beginning to green up, my daffodils are about to set flowers, and the blue berries are starting to flower.

I think a lot of folks here on the forum are in the post-election let down and just waiting for something positive to happen. It's pretty much a blah feeling, but there's always hope :-)
 

Keric4

Contributing Member
Philadelphia, New York City and Boston brace for record snowfall - Ice Age Now

Philadelphia, New York City and Boston brace for record snowfall
February 1, 2021 by Robert

One of the biggest winter storms in years is slamming the East Coast. Snow could pile up 2 feet (60 cm) in some areas. Near blizzard conditions very likely. Officials preparing for widespread power outages. Hundreds of flights canceled.

A powerful Nor’easter and winter storm will pound much of the Northeast and New England today and Tuesday with a variety of hazards, according to the National Weather Service. More than 70 million people across 17 states are hunkering down in its path.

Widespread heavy snow, gusty winds, near blizzard conditions and coastal impacts are very likely.

Expect major to extreme impacts across the region from Washington, D.C. to Pennsylvania to New Jersey to Maine, including the Philadelphia, New York, and Boston metro areas.

The National Weather Service warned that travel in New York City, where 20 inches of snow was expected, will become “very difficult to impossible,” and that the storm will cause travel problems for days. Boston could be hit by up to 16 inches of snow today alone, the National Weather Service warns.

Maximum storm snowfall totals are now a foot – or more – from eastern Pennsylvania to northern New Jersey and western Long Island, according to weather.com. The highest total as of 12 p.m. EST was 16 inches in Longhill Township, New Jersey.
New York’s LaGuardia Airport had 9 inches of snow on the ground as of 12 p.m. EST, with snowfall rates of an inch per hour.

On Monday evening, the heavy snow will expand from parts of the Mid-Atlantic into Northern New England and continue over parts of the Northeast into Wednesday.

Overnight Monday, the snow will begin to weaken over the Ohio Valley into parts of the Southern Appalachians. However, the snow will linger over the Central Appalachians into Wednesday morning.

In the meantime, a front approaching the Northwest will advance eastward to the Northern Intermountain Region/Northern Rockies to Southern California by Wednesday. The system will produce rain and some high elevation snow over parts of the Pacific Northwest and parts of Northern California on Monday.

When the front moves onshore overnight Monday, snow levels will lower over the region. On Tuesday afternoon, snow returns to California’s higher elevations and into parts of the Northern Intermountain Region. By Wednesday morning, the snow will move into parts of the Northern Rockies.

Winter Storm Orlena Winding Down Over the Northeast With Snow, Gusty Winds | The Weather Channel - Articles from The Weather Channel | weather.com

WPC's Short Range Public Discussion

National Weather Service

Heavy Snowfall in Northeast Disrupts Travel and Vaccine Rollout

Video:
Brutal winter storm slams Northeast

Possible historic snow in New York City. Video:
Major storm hits Northeast with possible historic snow in NYC

My hometown, just outside NYC got 21 inches!
 

TxGal

Day by day
Massive snowstorm hammers the U.S. East Coast - Ice Age Now

Massive snowstorm hammers the U.S. East Coast
February 2, 2021 by Robert

“A powerful Nor’easter and winter storm continues to impact much of the Northeast and New England with a variety of hazards,” warns the National Weather Service.

Those hazards include “widespread heavy snow, gusty winds, near blizzard conditions and coastal impacts.”

“Expect major to extreme impacts across the region from Pennsylvania to Maine, including the Philadelphia, New York, and Boston metro areas. Travel is not recommended.”

Moe than a foot of snow has been reported in parts of Connecticut, Maryland, Massachusetts, New Hampshire, New Jersey, New York, Pennsylvania and Vermont.

By Monday afternoon as much as 19 inches (48cm) of snow had already fallen in parts of New Jersey and Pennsylvania, and more than 17 inches (43cm) in New York City’s Central Park. This places the storm in the top 20 snowstorms in the city’s recorded history.

New Jersey and New York City both declared a state of emergency. Not only in the city, New York state Governor Andrew Cuomo declared a state of emergency in 44 other counties as well.

“This is a dangerous situation,” said Cuomo. “A life-threatening-situation.”

Parts of Pennsylvania and New Jersey have seen more than 2 feet of snow. The highest totals reported so far were in the Pennsylvania communities of Nazareth and Ancient Oaks, with 31 inches, according to the National Weather Service.

The US National Weather Service said snow will continue across the Central Appalachians/Mid-Atlantic to northern New England, before tapering off on Tuesday.

Snow hit the west coast last week, with some parts of California experiencing more than 6ft (2m) of snowfall.

The storm follows a record-breaking snowstorm that hit the U.S. East Coast in December when parts of northern New York received three feet (90cm) of snowfall and New York City received all of last year’s snow total in just that one storm.

During that storm the city of Binghamton, New York, received 45 inches (114cm) of snowfall, breaking its all-time record for the month of December. Snowfall totals in parts of Pennsylvania reached 40 inches (102cm), and the Williamsport Regional Airport broke its previous snowfall record, reporting 24.7 inches of snow.

Meanwhile, a front over the West Coast and a second front over Western Canada will move south and eastward toward the central U.S. The system will produce rain and higher elevation snow from the Pacific Northwest into Central California today with snow-levels lowering over the Northwest.

Overnight, the snow will move into the Northern Rockies and then into the Central Rockies with rain over the Southern Rockies.

Snow and rain/freezing rain will move into parts of the Northern High Plains/Northern Plains on Wednesday evening, and into parts of the Central Plains and the Upper Mississippi Valley overnight Wednesday.

As the rain and snow move into the Upper Mississippi Valley, rain/freezing rain areas will develop on Wednesday night into Thursday.

Huge snowstorm hits US east coast

US snowstorm: Record-breaking blizzard slams East Coast

WPC's Short Range Public Discussion
 

TxGal

Day by day
Adapt 2030 has a new podcast out:

Earth Change Intensity to 2024 as the Cosmic Age Shifts - YouTube

Earth Change Intensity to 2024 as the Cosmic Age Shifts
7,209 views • Feb 2, 2021

View: https://youtu.be/S9URnlHFh2A
Run time is 15:33

Synopsis provided:

These Earth changes with economic and societal shifts were expected by 2024 according to solar output models plus a second magnetic field forming in the outer solar system. A certain segment of society knows the changes and is laying ground work to stay in control after our planet shakes and splits at the crust. Oct 2024, first major wave.
 

TxGal

Day by day
The Oppenheimer Ranch Project has a new podcast out:

"Grindelwald Fluctuation' (1560-1630) - Little Ice Age - What We Can Learn From The Past Is Prepare. - YouTube

"Grindelwald Fluctuation' (1560-1630) - Little Ice Age - What We Can Learn From The Past Is Prepare.
4,244 views • Premiered 9 hours ago

View: https://youtu.be/W-6pk-Ol0EY
Run time is 10:38

Synopsis provided:

Newly transcribed chronicle describes extreme weather events that hit Bristol 400 years ago http://bit.ly/2O2vLv9
Weird weather in Bristol during the Grindelwald Fluctuation (1560–1630) https://bit.ly/3pJX2QZ
CMIP6 Solar Cycle Prediction https://bit.ly/36xtbUj
Medieval Warm - Little Ice Age Proxy Data Chart https://bit.ly/2Mxejye
Best Areas To Stay During An Ice-Age https://bit.ly/3cCb17t
 

TxGal

Day by day
According to the Satellites, Earth has Cooled Rapidly during the past 2 Months - Electroverse

UAH_LT_1979_thru_January_2021_v6-1-e1612346678120.jpg


ACCORDING TO THE SATELLITES, EARTH HAS COOLED RAPIDLY DURING THE PAST 2 MONTHS
FEBRUARY 3, 2021 CAP ALLON

During the past two months, Earth has cooled, rapidly.

The Version 6.0 Global Average Lower Tropospheric Temperature (LT) Anomaly for January, 2021 has come out at just +0.12 deg. C above the baseline, down 0.03 deg. C from the December, 2020 value of +0.15 deg. C.

[NOTE: Dr Roy Spencer and Dr John Christy –who update the chart at the beginning of every month– have changed the 30-year averaging period used to compute anomalies from 1981-2010 to 1991-2020. They stress, “this change does not affect the temperature trends.”]

Since 1979, NOAA satellites have been carrying instruments which measure the natural microwave thermal emissions from oxygen in the atmosphere.

The intensity of the signals these microwave radiometers measure at different microwave frequencies is directly proportional to the temperature of different, deep layers of the atmosphere.

The global temperature datasets represent the piecing together of the temperature data from a total of fifteen instruments flying on different satellites over the years. The graph (shown below) represents the latest update; updates are usually made within the first week of every month.


UAH Global Temperature Update for January 2021: +0.12 deg. C (new base period).

Contrary to some reports, the satellite measurements are not calibrated in any way with the global surface-based thermometer records of temperature. They instead use their own on-board precision redundant platinum resistance thermometers (PRTs) calibrated to a laboratory reference standard before launch.

The digital data for the above plot, as well as for various sub-regions of the Earth and for three other atmospheric layers, are available at the links below:

Lower Troposphere
Mid-Troposphere
Tropopause
Lower Stratosphere

I’ve also included the various regional LT departures from the 30-year (1991-2020) average for the last 13 months:

YEAR MO GLOBE NHEM. SHEM. TROPIC USA48 ARCTIC AUST
2020 01 0.42 0.44 0.41 0.52 0.57 -0.22 0.41
2020 02 0.59 0.74 0.45 0.63 0.17 -0.27 0.20
2020 03 0.35 0.42 0.28 0.53 0.81 -0.96 -0.04
2020 04 0.26 0.26 0.25 0.35 -0.70 0.63 0.78
2020 05 0.42 0.43 0.41 0.53 0.07 0.83 -0.20
2020 06 0.30 0.29 0.30 0.31 0.26 0.54 0.97
2020 07 0.31 0.31 0.31 0.28 0.44 0.26 0.26
2020 08 0.30 0.34 0.26 0.45 0.35 0.30 0.25
2020 09 0.40 0.41 0.39 0.29 0.69 0.24 0.64
2020 10 0.38 0.53 0.22 0.24 0.86 0.94 -0.01
2020 11 0.40 0.52 0.27 0.17 1.45 1.09 1.28
2020 12 0.15 0.08 0.22 -0.07 0.29 0.43 0.13
2021 01 0.12 0.34 -0.09 -0.08 0.36 0.49 -0.52

THE BOTTOM LINE


The global lower atmosphere of our planet –the area that sustains all life– is colder TODAY than it was during much of the 2010s, the 2000s, large portions of the 1990s, as well as late-1987–and cooling!

Climate alarmists, pray tell how this is possible…

…and while you’re at it, explain how Total Snow Mass for the Northern Hemisphere is comfortably exceeding the 1982-2012 average (as it has been for the past few years), and now building exponentially:

fmi_swe_tracker-24.jpg

FMI

The COLD TIMES are returning, the mid-latitudes are REFREEZING in line with the great conjunction, historically low solar activity, cloud-nucleating Cosmic Rays, and a meridional jet stream flow (among other forcings).

Both NOAA and NASA appear to agree, if you read between the lines, with NOAA saying we’re entering a ‘full-blown’ Grand Solar Minimum in the late-2020s, and NASA seeing this upcoming solar cycle (25) as “the weakest of the past 200 years”, with the agency correlating previous solar shutdowns to prolonged periods of global cooling here.

Furthermore, we can’t ignore the slew of new scientific papers stating the immense impact The Beaufort Gyre could have on the Gulf Stream, and therefore the climate overall.


Prepare accordinglylearn the facts, relocate if need be, and grow your own.
 

TxGal

Day by day
Massive snow fall in Scotland leaves 4x4 covered to roof with snow- and there's more to come -- Earth Changes -- Sott.net

Massive snow fall in Scotland leaves 4x4 covered to roof with snow- and there's more to come

Jon Hebditch
The Record
Wed, 03 Feb 2021 13:42 UTC

snow
© Cawdor Estate

Massive snow fall across Scotland left a four-by-four covered up to its roof in the white stuff.

The country has been battered by bad weather with more set to come this week.

A stunning picture from the Cawdor estate near Nairn in the Highlands shows the snow up to roof level of the Toyota Hilux.

The vehicles stand nearly six foot off the ground.

View: https://youtu.be/5cD0uzVpR7c
Run time is 4:34

View: https://youtu.be/8EnqbE_A_3w
Run time is 2:12

The pictures, posted on Facebook, were simply captioned: 'When the snow is higher than your Hilux!'

snow
© Cawdor Estate

Scots are braced for more wintery conditions in the week ahead.

The Met Office has issued an amber weather warning from Tuesday until Sunday as six days of snow and ice are expected across the country.

Up to 20 inches of snow is expected to dump on the country from Friday until 6pm on Saturday amid a week-long spell of weather chaos.


View: https://youtu.be/xHRMOdwtjDU
Run time is 0:48

Strathclyde, Grampian, Central, Tayside and Fife and Highlands & Eilean Siar will will see the worst of the conditions due to persistent and heavy snow.

Experts say between 10cm and 15 inches of snow could land in areas of high ground in The Highlands and Western Isles, South-west Scotland, and Lothian Borders.

The Met Office said: "By Friday, snow is expected to become more widespread, persistent and heavy, and will settle at increasingly low levels. The heaviest snowfall should clear later on Saturday.

"Fresh snowfall totals of 10-15 cm is possible at low-levels, with 20-30 cm accumulating above about 150 m. Some high ground exposed to strong easterly winds could see as much as 50 cm building up by Saturday evening.

"However some places close to the east coast may see only small amounts of snow settling.

"The strong easterly winds will likely lead to drifting snow, temporary blizzard conditions, and ice forming on exposed power lines and phone masts."

NHS Grampian said locals should 'walk like a penguin' when out on icy roads to stop from falling.

View: https://youtu.be/0OctQy574fo
Run time is 2:37
 

northern watch

TB Fanatic
Weird weather in Bristol during the Grindelwald Fluctuation (1560–1630)
Evan T. Jones
Rose Hewlett
Anson W. Mackay
First published: 01 February 2021

Abstract
The Grindelwald Fluctuation (1560–1630) was a cooling phase during the ‘Little Ice Age’ (c.1300–1850). Poor weather during the Fluctuation contributed to harvest failures, mass starvation and political crises across the globe. This paper examines information taken from Bristol chronicles that discuss some of the extreme weather events of the period. The entries support the notion that the Grindelwald Fluctuation featured some extraordinarily poor weather, such as great frosts, floods, severe storms, unseasonal snowfalls and droughts.

image

The thirteenth to the nineteenth centuries witnessed a series of wide‐scale climatic deteriorations, commonly known as the ‘Little Ice Age’, which resulted in the lowest temperatures experienced globally for the whole of the Holocene (past 11 700 years) (Matthews and Briffa, 2005; Marcott et al., 2013). The Grindelwald Fluctuation (1560–1630 CE) is the name given to a pronounced cooling phase within this era, taking its name from the long‐observed advance of the Swiss Grindelwald Glacier during the late sixteenth and early seventeenth centuries. This glacial advance has been ascribed, along with many other indicators of falling temperatures, to a phase of global cooling exacerbated by huge volcanic eruptions at Colima, Mexico (1585); Nevado del Ruiz, Columbia (1595); and Huaynaputina, Peru (1600) (Toohey and Sigl, 2017; Degroot, 2018).
The decades of the Grindelwald Fluctuation encompassed some of the ‘worst’ weather of the last millennium. A series of cold and wet summers in the 1590s was associated with the last major famine in England, while in many other parts of the world, poor weather, aggravated by political crises, resulted in mass starvation (Clark, 1985; White, 2011; Parker, 2018). Matters did not improve markedly over the following decades: Parker (2013) argued for a ‘General Crisis of the seventeenth century’ as crop yields fell and rulers struggled to raise revenues from their people.

As concerns about global warming continue to rise in the twenty‐first century, climate scientists have put considerable effort into reconstructing past climatic change (Masson‐Delmotte et al., 2013). To understand how the world's climate might further change in the future, it is useful to know how and why it changed in the past. The problem for scientists is that accurate and systematic weather recording only goes back a few hundred years, even in Britain, and for much of the world, such weather records have only been kept since the twentieth century. For earlier periods, scientists thus rely on paleo‐environmental evidence retrieved from stratified deposits, such as ice cores, and marine and lake sediments. Paleotemperatures from these deposits can be derived from microfossils, such as pollen and foraminifera, or from the ratios of specific elements and isotopes. Alternatively, very high‐resolution climate records can be derived from ‘natural archives’ that consist of annually resolved records, such as tree rings, to assess weather conditions within a given year. With data from such sources, it is possible to learn much about changing environmental conditions on an annual, or even seasonal, basis – albeit the reconstructions often disagree in absolute terms (Masson‐Delmotte et al., 2013).

While most paleo‐environmental reconstruction has been generated by scientists, environmental historians have shown that they too can throw light on climatic change and the impact of the weather on human societies, particularly for the sixteenth to nineteenth centuries. For example, Degroot (2018, pp. 27–31) used weather records from ships’ logbooks to assess the nature and impact of climate change in the Dutch Republic during the seventeenth century. His work suggests that the Grindelwald Fluctuation not only led to a general cooling, it was also associated with increased storminess and more unsettled weather. Meanwhile, a recent article on the ‘Great Snow’ of 1614/1615 (Veale et al., 2018) has shown that a multi‐source approach can be used to build up a sophisticated picture of the nature, location and impact of exceptional weather events during the early seventeenth century.

The current article presents evidence from a documentary source that casts light on exceptional weather events during the Grindelwald Fluctuation. All the material comes from three Bristol chronicles/annals. These chronicles recorded matters of note in the city and are identified here as ‘Ricart’, ‘Adams’ and ‘Anon. Bristol’. At this time, Bristol was the second port of the realm and one of the three largest cities in England, with an extensive overseas trade connecting it to Ireland, France, Spain and Portugal (Lobel and Carus‐Wilson, 1975; Stone, 2011). The city's strong and independent identity was reflected, among other things, by a chronicle‐writing tradition that continued until the early nineteenth century (Sweet, 1997). The first two chronicles used here are well known. Ricart's was the official municipal ‘calendar’, kept by the town clerk from 1479 (Ricart and Toulmin Smith, 1872). While it contains some references to weather events, the chief focus was civic and political matters. Adams's chronicle is based on a manuscript compiled by William Adams of Bristol during the 1630s (Adams and Fox, 1910) and references some major weather events. The third chronicle (Anon. Bristol, n.d.) has not been published. While it has been in the care of Bristol Archives since 1931, its fragile state meant that access was only granted recently to allow it to be photographed and transcribed (Jones, 2019; Figure 1). The chronicle is written in at least three different hands and seems to have been compiled over the course of the late seventeenth to early eighteenth centuries. In common with other chronicles, its Tudor and Stuart entries would have drawn on information taken from earlier annals, now lost. For present purposes, the chief interest of the chronicle is that it contains many entries that discuss severe weather events in the city – particularly for the period 1560–1630.

image
Figure 1
Open in figure viewerPowerPoint
Part of the ‘Anonymous’ chronicle, 1557–1571 (Bristol Archives, 09594/1).

The Bristol chronicles record unusual weather events that caught the attention of the chroniclers: severe floods, extreme frosts, destructive storms, droughts, unseasonal blizzards and poor summer weather that led to food shortages. The entries suggest that Bristol's weather during the Grindelwald Fluctuation was not just cold – it was highly erratic, resulting in a series of extremely destructive weather events. These included the famine years of the 1580s and 1590s, the Great Flood of 1607 and the Frosts of 1564/1565 and 1607/1608. The following section reproduces some of the accounts from the chronicles that relate directly to weather events or those that can be assumed to have resulted from poor weather – such as harvest failures and spikes in the price of grain. As with all such chronicles or annals, the entries are listed by year. There was usually no attempt to provide an overarching narrative or to relate the events of a given year either to other entries recorded that year or to the events of different years.

Extracts from the three chronicles 1

Winter 1564/1565 (Anon. Bristol)
October the 7th [1564] was seen in the firmament 2 in Bristol beams as red as fire coming out as it were of a furnace of length like the pole and there followed a very hard Winter of ice and snow, Hungroad 3 was frozen so hard that mariners & others went over dry shod.
29 September 1568–28 September 1569 (Anon. Bristol)
A great deal of corn was sent out of Bristol into Wales by reason of the great dearth that was there but notwithstanding many people perished for want of food.
29 September 1584–28 September 1585 (Anon. Bristol)
Wheat sold in Bristol at 7s. per bushel and all other grain very dear. But for relief the Commons begun to make an insurrection. The mayor wisely pacified them and caused the Pensford 4 bakers to come into the city with bread every day in the week and the Mayor caused and procured corn to come from Danzig 5 to Bristol whereby great store of rice 6 came hither as was sold at 4s. per bushel until Michaelmas. The Spring tide did rise so high at Saint David's Flood 7 […….] broke in the Sea and did much […….……] City and in Wales.
29 September 1596–28 September 1597 (Anon. Bristol)
A great famine in divers places and in the city of Bristol all kinds grain was very dear so that the poor was in very great want…wheat at 20s. per bushel malt at 8s., rye at 10s. but Danzig rye at 5s. 8d.
4–8 October 1603 (Ricart and Toulmin, pp. 63–64)
This year upon the fourth of October was the greatest snow that ever was known by the memory of man, which continued four days. And by reason that the leaves were then upon the trees, very many trees of all sorts, especially of fruit trees, were thrown down by the roots, and the limbs and boughs of many others were broken in pieces.
20 January 1607 8(Anon. Bristol)
January 20th: in the morning being Tuesday at high water there arose such a high flood that the sea drove over the banks and drowned all the marsh country in Wales and on the English coasts. It drowned the cattle and carried away the corn and hay, and the people to save themselves climbed upon the tops of houses and trees, and it did carry away many houses and trees and many people were drowned the flood came on so fast. It came so fast & high at Henbury 9 that the waters continued a long time a fathom deep that the people were obliged to abide on the trees two or three days. And this mayor Mr Barber hearing of their distress commanded cock‐boats 10 to be hauled thither to fetch the people that were on trees that they might not perish with cold and hunger. And in the city of Bristol all the lower part were drowned about 4 or 5 foot so that a boat of about five tons came up to Saint Nicholas crowd door. 11 The boatman put his boathook against the lower step and thrust off his boat again. The Waters were up in Saint Stephen's, Saint Thomas and Temple churches halfway up the seats. And the Bridge arches were stopped so that the water buoyed up higher towards Temple and Redcliff sides than in any other parts which at the return it brought down the river great trees but did not hurt the Bridge. The merchants received great losses in their storehouses and cellars by it.
20 November 1607–8 February 1608 (Anon. Bristol)
November the 20th 1607 began a frost which lasted till the 8th February following at which time the River of Severn and Wye were so hard frozen that people did pass on foot from side unto the other and played gambols 12 and made fires to roast meat upon the ice. No long trows 13 etc could come to Bristol and when the ice broke away there came swimming down with the current of the tide great massy flakes of ice which endangered many ships that came up the [Bristol] Channel into Kingroad. 14 The continuance of the frost starved a great number of birds, and made corn sell very dear.
1608–1609 (Anon. Bristol)
This year there was a great dearth throughout the Realm and many people perished for want of food. But the Lord in his mercy supplied our scarcity with store of corn brought from foreign parts.
Winter 1610/1611 (Anon. Bristol)
The winter proved very stormy in so much that it occasioned the greatest shipwrecks that ever was known in England. And in Kingroad near Bristol a great Flemish ship that came from the Indies richly laden with spices and other rich commodities was cast away in sight of the point, she divided in two, one half part remained in the place and the other half drove up the stream towards Aust passage. 15 And the men were all drowned by reason of the storm which happened on the 24th October [1610] on Wednesday about 4 of the clock in the afternoon, she coming up the River.
May–August 1611 (Adams and Fox, p. 187)
This year from May to August, being 4 months, was the driest time that any man then living ever knew, for all the grass was starved and dried up like ground new tilled, which starved many cattle, and had starved more but it pleased God to send a mild and warm winter to make amends.
Winter 1612/1613 (Anon. Bristol)
The winter proved very hard and stormy that it shook most of the houses in the City of Bristol and caused great shipwrecks in diverse places.
1613–1614 (Anon. Bristol)
And this year there was a great scarcity of corn, there came to Bristol from France, Denmark and other places from September 1613 to June 1614 of ships and barges to the number of 104 with wheat, rye and barley 25 105 quarters. 16
1623–1624 (Adams and Fox, p. 213)
This winter fell out extreme cold and frosty, with such store of snow that many fowl and cattle died for want of sustenance: which cold lasted until May [1624]; and the summer after that proved very dry; grass and hay was very scant, and water failed in many places, whereby cattle were liken to starve again in many places.
Summer 1626 (Adams and Fox, pp. 216–17)
Concerning famine or dearth of corn we stood in much fear this year for all this summer proved very wet and stormy, that corn could not ripen but was beat down in many places; insomuch that famine must have followed by the judgement of all men, if God had rained down His anger a little longer upon the fruits of the earth.
These entries suggest that the period included some awful weather. But what can be read from them? Are they reliable? How useful are they for understanding the weather of the period?

End of Part 1

Weird weather in Bristol during the Grindelwald Fluctuation (1560–1630) - Jones - - Weather - Wiley Online Library
 

northern watch

TB Fanatic
Part 2

First, the entries do not record the weather in a systematic manner: they do not record all the weather, only events that the chronicler thought noteworthy. They also do not record the weather using an objective measurement system for temperature, precipitation or wind speed. On the other hand, the records are not merely impressionistic. The annalists sought to record the extent and significance of events in relative terms. Stating how the high the flood waters rose in 1607, or the extent of riverine freezing in 1564/1565 and 1607/1608, provided a yardstick for comparing weather events.

Moreover, the descriptions, in at least some instances, can be corroborated from independent sources. The Gloucestershire Court of Sewers held jurisdiction over sea defence and land drainage mechanisms, and its records for 1607 reveal the extent of tidal flooding between Shirehampton (on the Bristol Avon) and Slimbridge (Gloucestershire) and also the condition of the sea walls before and after the event (Hewlett, 2020). This evidence supports the annalist's description of the severity of the flood from a local perspective, and surviving flood markers in churches bordering the Severn Estuary (Figures 2 and 3) confirm that the height of the inundation has not been exceeded. 17 The 1607 flood and the storms of 1612/1613 were also reported in London news pamphlets (Figure 4), albeit in more sensational terms (Anon., 1607; Jones, 1607; Anon., 1613a,b. Similarly, the great frosts of 1564/1565 and 1607/1608 are discussed in a 1608 pamphlet, the second freeze including the holding of the first known ‘Frost Fair’ on the River Thames at London (Anon., 1608; Figure 5). In Bristol itself, the ‘grete freese’ of February 1565 resulted in the loss of water supply to the city, while from Christmas 1607 to early January 1608, the Mayor of Bristol was forced to spend much money on ice clearance. 18 Again, in this context, the annalist's account of the freeze in Bristol seems balanced and fact‐based. However, crosschecking has also revealed a few instances in which the year of an event has been recorded incorrectly in an annal, the true date being either a year earlier or later. For instance, the great freeze of 1564/1565 is recorded under ‘1564’, which would imply that the freeze occurred in 1563/1564 (Anon. Bristol). This is most likely because of the use of alternative calendaring systems at this time, which can cause confusion, even for modern historians. 19

image
Figure 2
Open in figure viewerPowerPoint
Map of Bristol and the Severn Estuary.

image
Figure 3
Open in figure viewerPowerPoint
The Great Flood memorial in Kingston Seymour church, Somerset, recorded here as 1606 because the year was typically believed to begin on ‘Lady Day’ (25 March).

image
Figure 4
Open in figure viewerPowerPoint
Facsimile of the title page of A true report, Ernest. E. Baker (Weston‐super‐Mare Gazette, 1884).

image
Figure 5
Open in figure viewerPowerPoint
Depiction of London's ‘Frost Fair’ held on the River Thames, 1608. Taken from the cover of Thomas Dekker's news pamphlet, The Great Frost (1608).

The approach taken by Bristol's annalists is mirrored in their discussions of other catastrophic events in the city. The death toll from plague outbreaks, for instance, was based on an analysis of Bristol's parish burial registers and Bills of Mortality (Adams and Fox, 1910, p. 64). 20 Similarly, the figures relating to grain imports to relieve famine were said to have been extracted from the city's port books (Adams and Fox, 1910, p. 201). 21 The source of the grain price data is not mentioned but was presumably derived from the commercial records of the merchants who dominated the city. Indeed, the approach in the Bristol annals shows more attention to detail, evidence and sources than many ‘histories’ of this period. Such an emphasis on factual reporting probably reflects the culture of an intensely commercial port city, whose overseas merchants depended on accurate and impartial intelligence to make a living.

If the accounts provided in the annals were generally accurate, they were not complete. They reveal that people in the period followed weather patterns closely. Yet the job of an annalist was not to record all weather events, or even all exceptional weather events. Each chronicler recorded what he or she felt to be the most noteworthy events of a given year. That meant the degree of weather reporting depended on what else was happening at the time. A good example of this is the failure of the ‘Anonymous’ chronicle to record the great snowfall of 4–8 October 1603, which destroyed so many fruit trees in the city. This omission can be ascribed to the annalist's decision to focus instead on a terrible plague outbreak, which killed 2600 people in Bristol between 18 July 1603 and February 1605. Given that this epidemic wiped out about a fifth of the city's population in just 18 months (Slack, 1977, p. 51), the chronicler's focus does not seem unreasonable. More generally, too much should not be read into the fact that the extant Bristol chronicles have fewer weather entries for both the decades before 1560 and for those after 1640. It is possible that there were fewer extreme weather events before and after the Grindelwald Fluctuation. Yet it would be unsafe to assume this from these surviving Bristol chronicles.
The entries for the late sixteenth and early seventeenth centuries suggest that the period was marked by many destructive weather events. Some of these, such as great frosts and harvest failures, can be linked directly with the global cooling detected by climate scientists. The storms of the early seventeenth century fit with evidence derived from the logbooks of Dutch mariners, which suggest that the period witnessed a general increase in storminess (Clarke and Rendell, 2007). Other entries seem to imply that the weather in the period was also simply extremely erratic, including prolonged droughts and unseasonal blizzards. That something odd had happened to the weather was certainly noticed by contemporaries, and not just in Bristol. In 1613, an anonymous London pamphleteer (Anon., 1613a; Figure 6) reflected that:

image
Figure 6
Open in figure viewerPowerPoint
Depiction of the storms of 1612/1613. Taken from the London news pamphlet, The last terrible Tempestious windes and weather (1613). © British Library Board.

In this old, and last age of the World, we yearly behold the strange alterations of times & seasons…
We have within these few years, as well within this our native country of England as in foreign nations, been most grievously stricken with the bitter blasts of powerful greatness, one while with the darts of death, as by plagues & pestilence, continuing long amongst us; another time by dry summers, and parching heats, droughts, & sweating sulphurs drying up the moistures of the earth, to cause barrenness with scarcity, then freezing and cold winters in more than usual extremity to annoy us; another time by floods and overflowings of waters breaking from the bounds of the Seas, in which merciless element many hundreds have perished and have lost both life and goods… 22
Taken in isolation, it would be easy to dismiss such statements as hyperbolic. The colourful language and providentialism of Jacobean news writers might make the modern reader suspect exaggeration. Yet the authors’ observations should not be dismissed just because they interpreted these events as evidence of God's wrath with a sinful world. Both climate science and environmental history point to the Grindelwald Fluctuation being an age of extreme weather.
Links between anthropogenic climate change in the modern world and different types of extreme weather events are now well established (Coumou and Rahmstorf, 2012). This could increase the costs of weather‐related hazards for about 350 million people across Europe in the coming decades, accompanied by a 50‐fold increase in weather‐related fatalities (Forzieri et al., 2017). Such models fit with anecdotal evidence that the world is already experiencing more extreme weather. Recent examples in the United Kingdom include the record temperature highs of December 2019 and the Severn Valley floods of February 2020.
The drivers behind the exceptional weather events recorded in the early modern Bristol chronicles and the London news pamphlets are different to today. During the Grindelwald Fluctuation, short‐term forcing factors, such as volcanic eruptions, led to a more disturbed climate within the context of general global cooling. The economic, political and cultural context of the seventeenth century was also very different to that of the twenty‐first century. This had a major impact on both the way severe weather was understood and the impact it had on contemporaries. Yet, despite these differences, the climate and weather of the early modern period provides a reminder of how destructive climate change and severe weather can be in both the short and long term. For this reason alone, the period merits further research through multi‐source and interdisciplinary approaches that can cast light on both individual weather events and their relationship to the causes and effects of climate change.

Acknowledgements

This research was carried out with the support of The Cabot Project (University of Bristol), funded by Gretchen Bauta, a private Canadian benefactor. For their comments and advice on earlier drafts of this paper, we thank Peter Coates, Margaret Condon, William Gilbert, Marianna Dudley and Bruce Campbell. The article is dedicated to Caroline Williams (1962–2019), founding Board Member of the Centre for Environmental Humanities, University of Bristol.
  • 1 Spelling, capitalisation and punctuation modernised. All dates are ‘old style’. New style dating (following Britain's adoption of the Gregorian calendar in 1752) would be 10 days later.
  • 2 The sky or heavens. The phenomenon described is presumably the aurora borealis.
  • 3 An area of the River Avon, 4 miles downriver from Bristol and about a mile from its confluence with the Severn Estuary. The Hungroad was a regular anchorage within the outer port of Bristol (Figure 2).
  • 4 A large village 7 miles south of Bristol.
  • 5 The Hanseatic port of Gdańsk, Poland.
  • 6 This may be a transcription error on the part of the chronicler, ‘rye’ being more probable.
  • 7 It seems possible the chronicler meant to write Saint David's Head – a well‐known navigation point in Pembrokeshire, Wales. Unfortunately, part of the entry has been damaged.
  • 8 Ricart contains an independent but compatible account of the flood, which suggests that the inundation was caused by ‘the wind blowing hard at south‐west’, p. 183.
  • 9 The large parish of Henbury covered a considerable area of low‐lying coastal land.
  • 10 A small rowing boat. Adams gives the mayor's name as Barker.
  • 11 Crowd: the church crypt. The road gradient and level beside St Nicholas were greatly altered during the rebuilding of Bristol Bridge (opened 1768). The bottom of the crowd door is now c. 2m below street level, and the lower step must have been below that: Rose Hewlett, ‘The 1607 Severn Estuary flood: A true report’ (forthcoming doctoral thesis, University of Bristol). A boat of five tons would be one capable of carrying five tons of cargo.
  • 12 To leap or caper.
  • 13 A flat‐bottomed cargo boat widely used on the rivers Severn and Wye.
  • 14 A bay and anchorage in the Bristol Channel between Avonmouth and Portishead (Figure 2).
  • 15 The ferry crossing between Aust and Beachley, 8 miles upriver from Avonmouth.
  • 16 This is about 5000 tons.
  • 17 At Peterstone, St Brides Wentlooge, Nash, Goldcliff and Redwick (Gwent) and Kingston Seymour (North Somerset).
  • 18 In February 1565, the ‘Key Pipe’ froze (supplying water to the quay head), and building work ceased due to the ‘grete freese’: Bristol Archives, F/Au/1/9, pp. 36, 39. From Christmas 1607 to early January 1608, there are numerous payments relating to ice clearance in the city: Bristol Archives, F/Au/1/16, pp. 209–210.
  • 19 The Bristol annals normally took Michaelmas (29 September) as the start of the year, this being when the mayor and sheriffs commenced office. The year referred to in the annals is usually the year in which the mayor etc. ended their year‐long term.
  • 20 The death toll from the 1603–1605 plague outbreak was said by Adams to be ‘according to the church books and printed tickets’.
  • 21 Many of the port books for Bristol still survive, and they do, indeed, record trade at a level of detail that would have allowed such calculations to be made: The National Archives, E 190 series.
  • 22 Spelling modernised.
End of Part 2 of 2

Weird weather in Bristol during the Grindelwald Fluctuation (1560–1630) - Jones - - Weather - Wiley Online Library
 
Last edited:

northern watch

TB Fanatic
The Oppenheimer Ranch Project has a new podcast out:

"Grindelwald Fluctuation' (1560-1630) - Little Ice Age - What We Can Learn From The Past Is Prepare. - YouTube

"Grindelwald Fluctuation' (1560-1630) - Little Ice Age - What We Can Learn From The Past Is Prepare.
4,244 views • Premiered 9 hours ago

View: https://youtu.be/W-6pk-Ol0EY
Run time is 10:38

Synopsis provided:

Newly transcribed chronicle describes extreme weather events that hit Bristol 400 years ago http://bit.ly/2O2vLv9
Weird weather in Bristol during the Grindelwald Fluctuation (1560–1630) https://bit.ly/3pJX2QZ
CMIP6 Solar Cycle Prediction https://bit.ly/36xtbUj
Medieval Warm - Little Ice Age Proxy Data Chart https://bit.ly/2Mxejye
Best Areas To Stay During An Ice-Age https://bit.ly/3cCb17t

From the youtube post

Glaciers-fluctuations-in-the-Alps-in-the-last-millennium-Thick-line-Grosser-Aletsch.png
 

Martinhouse

Deceased
It's going to be cold here in northern Arkansas, too, but nothing like it will be up north. My brother in Cedar Rapids will be seeing one night down to -12 and I think one day only up to -1. I hate to think how much colder it will be in Minnesota, Wisconsin, and Michigan. I'm so glad I moved south to Arkansas! We still can have some awful winters here, but it's on a whole different scale than where I spent the first half of my life just outside of Minneapolis!
 
Last edited:

TxGal

Day by day
Starting Sunday we're getting the whopper of an Arctic front that is going to just clip us, but really wallop everyone north and east of us. Even still, it's dropping our daytime temps to a more normal level (we're a little warm right now), but our night temps are going to tank into the 20s at current estimate. Lovely.
 
Top