Solar Grand Solar Minimum part deux

TxGal

Day by day
Beijing Records Coldest December Day in 42 Years - Electroverse

cold-Beijin-Dec-30-crop-scaled-e1609329112152.jpg


BEIJING RECORDS COLDEST DECEMBER DAY IN 42 YEARS
DECEMBER 30, 2020 CAP ALLON

Following the news that China is increasing LNG imports to record levels in order to battle the extreme cold, the nation’s capital suffers its coldest December temperature since the 1970s.

With a low of -26C (-14.8F) on the morning of Tues, Dec. 29, Beijing recorded its coldest December day in 42 years, since 1978 (solar minimum of cycle 20).

As reported by globaltimes.cn, bitter winds accompanied the cold, driving the feels-like temperature even lower and leaving residents “stunned at the sudden temperature drop.”

View: https://twitter.com/dCl2VyKgGip5lNM/status/1344190509523169280

China’s National Meteorological Center issued an orange cold wave warning for Wednesday following Tuesday’s record low temps, saying most of the central and eastern regions would experience strong gusty winds and further temperature drops.

“The weather forecast for Beijing: it is even colder than the North Pole,” a netizens (citizen of the net) wrote on China’s Twitter-like Sina Weibo early Wednesday morning– a fact serving as further evidence that the Arctic cold is effectively shifting south (more on that here).

A mass of polar air descended down through Russia and into China this week, resulting in record-breaking temperatures of -13C (8.6F) even sweeping Beijing’s most built-up metropolis areas, bringing with it a reported windchill of -22C (-7.6F).

That incredible low of -26C (-14.8F) was registered at the Beijing Foyeding meteorological observatory, the highest weather observatory in Beijing — a reading that comfortably busted the all-time record from 1978.

“Tough as I am like a wolf from north Xinjiang, I pronounce today that I caved in,” a netizen from the northern part of Northwest China’s Xinjiang Uygur Autonomous Region who lives in Beijing said.

Looking forward, the official China Meteorological Center has said the cold wave will affect at least 27 provinces, autonomous regions and municipalities, while parts of southern China, located in the subtropical zone, will also suffer rare sub-zero temperatures in the coming days and weeks.

The MSM is painting this unprecedented freeze as a cause of the recent COVID-19 flare-ups in Beijing, and have completely sidestepped the hammer-blow such debilitating cold inflicts on their global warming narrative.

The mainstream reports that the recent record cold weather “has made the environment particularly vulnerable to coronavirus, which can survive better and spread more easily at lower temperatures, proven in the relentless re-occurrences of cold-chain related COVID-19 infections that have struck many regions in China for the last couple of months.”

However, 1) the city of Beijing, with is 22 million residents, has confirmed a mere 22 new infections since December 14, and 2) the “relentless re-occurrences of cold-chain related COVID-19 infections” sounds a lot less like global warming and a lot more like global cooling to me.

Times are hard for logical people right now.

Stay strong.

And prepare.

The COLD TIMES are returning, the mid-latitudes are REFREEZING in line with historically low solar activity, cloud-nucleating Cosmic Rays, and a meridional jet stream flow.

Both NOAA and NASA appear to agree, if you read between the lines, with NOAA saying we’re entering a ‘full-blown’ Grand Solar Minimum in the late-2020s, and NASA seeing this upcoming solar cycle (25) as “the weakest of the past 200 years”, with the agency correlating previous solar shutdowns to prolonged periods of global cooling here.

Furthermore, we can’t ignore the slew of new scientific papers stating the immense impact The Beaufort Gyre could have on the Gulf Stream, and therefore the climate overall.


Prepare accordinglylearn the facts, relocate if need be, and grow your own.
 

TxGal

Day by day
Prepare for more Extreme Cold Weather in Yucatán, Mexico warns meteorologist - Electroverse

snowman-on-beach-1927360_1280-e1609325102938.jpg


PREPARE FOR MORE EXTREME COLD WEATHER IN YUCATÁN, MEXICO WARNS METEOROLOGIST
DECEMBER 30, 2020 CAP ALLON

Anthropocentric global warming is junk science, I can’t put it anymore plainly: expansive polar air masses have engulfed both hemispheres of late as the low solar activity we’ve received for the past decade+ finally impacts the climate.

Residents accustomed to Yucatán’s heat were forced to huddle under blankets this past week+ as the anomalous wintry blast that gripped the eastern U.S. sunk south of Florida into Mexico:


Forecast GFS 2m Temp Anomalies for Dec. 27 [tropicaltidbits.com].

As warned by Yucatán weather forecaster Juan Vázquez Montalvo, this unusual Arctic cold is only forecast to intensify into the New Year.

We’re already ending the coldest month of December in years, said Montalvo.

Motul and the general Henequen area held the record for the day, with 8C (46F), which feels even colder with humidity in the 60-70% range: “This is due to the cold air mass that was intense, which accompanied the 23rd cold front of the season,” Montalvo told local media. And looking ahead, computer models indicate it should get even colder in January and February, he said.

The 2020-2021 winter season may be one for the record books, reports yucatanexpatlife.com, adding that of the 55 cold fronts predicted, half should descend far enough south to reach the Yucatan Peninsula–a phenomenon ‘actual science’ suggests is due to low solar activity’s impact on the jet streams, as it weakens their usual tight ZONAL flow to a wavy MERIDIONAL one (more on that linked here).

“The lowest temperatures on the Yucatán Peninsula occur in January, with a record of 5C (41F) in the city of Mérida that was recorded in 1971,” said Montalvo, who has suggested, if Arctic fronts materialize as forecast, that this record will fall.

Few homes in Yucatán are equipped with heaters or fireplaces to ease the chill, concludes theyucatanexpatlife.com article.

Stay tuned for updates.

The COLD TIMES are returning, the mid-latitudes are REFREEZING in line with historically low solar activity, cloud-nucleating Cosmic Rays, and a meridional jet stream flow.

Both NOAA and NASA appear to agree, if you read between the lines, with NOAA saying we’re entering a ‘full-blown’ Grand Solar Minimum in the late-2020s, and NASA seeing this upcoming solar cycle (25) as “the weakest of the past 200 years”, with the agency correlating previous solar shutdowns to prolonged periods of global cooling here.

Furthermore, we can’t ignore the slew of new scientific papers stating the immense impact The Beaufort Gyre could have on the Gulf Stream, and therefore the climate overall.


Prepare accordinglylearn the facts, relocate if need be, and grow your own.
 

TxGal

Day by day
Russian Military Freight Ship gets stuck in thick Arctic Sea Ice - Electroverse

sparta3-rosoboronlogistika-e1609322235140.jpg


RUSSIAN MILITARY FREIGHT SHIP GETS STUCK IN THICK ARCTIC SEA ICE
DECEMBER 30, 2020 CAP ALLON

The Russian military freight ship “Sparta-III” got stuck in thick ice in the Yenisei Bay during a commercial voyage, a source in the shipping industry told tass.ru.

On its way from Dudinka to Arkhangelsk on December 13, the 9,490 ton deadweight ship froze in the waters of Yensiey Bay–a long estuary through which the lower Yenisey flows into the Kara Sea, Arctic Russia (shown below).


The Sparta-III in the Yenisey Bay, Dec. 19, 2020 [thebarentsobserver.com].

The ship is owned and operated by Rosoboronlogistika, a military shipping company tasked with transporting goods and equipment to Russian military bases, reports thebarentsobserver.com.

On December 17, it was reported that repeated attempts to break loose had failed and that Rosoboronlogistika had requested emergency assistance from “a big icebreaker.”

According to the source, reserves of fuel and water onboard Sparta-III were running critically low, and the crew had been fighting hard with icing; various equipment onboard had frozen.

The company said in a statement: “As of 18:00 on December 17, 2020, due to deteriorating ice conditions, the vessel is drifting in the Yenisei Gulf. In the coming days, a nuclear icebreaker will be sent to escort the vessel.”

There is fast-growing ice in the area, maps from the Russian Arctic and Antarctic Research Institute reveal, as the Siberian winter begins biting hard.

Record breaking cold is persisting across a vast portion of transcontinental Russia with temperatures of -50C (-58F) and below reported:

Such conditions require solid icebreaking capacity for safe navigation, and with an ice-class of just 1A the Sparta-III wasn’t expecting and isn’t equipped for sea ice more than 1 meter (3.3 feet) in thickness.

Stay tuned for updates.

The COLD TIMES are returning, the mid-latitudes are REFREEZING in line with historically low solar activity, cloud-nucleating Cosmic Rays, and a meridional jet stream flow.

Both NOAA and NASA appear to agree, if you read between the lines, with NOAA saying we’re entering a ‘full-blown’ Grand Solar Minimum in the late-2020s, and NASA seeing this upcoming solar cycle (25) as “the weakest of the past 200 years”, with the agency correlating previous solar shutdowns to prolonged periods of global cooling here.

Furthermore, we can’t ignore the slew of new scientific papers stating the immense impact The Beaufort Gyre could have on the Gulf Stream, and therefore the climate overall.


Prepare accordinglylearn the facts, relocate if need be, and grow your own.
 

hummer

Veteran Member
Whoa...Lots of info to go through today! This ought to keep me busy so I don't have to shovel snow until tomorrow... :eek::)
Have a Happy New Year all. I am snuggled in until next year.
 

northern watch

TB Fanatic
Strongest low in the world heading towards Alaska
Tyler Hamilton
Meteorologist
The Weather Network

Wednesday, December 30th 2020, 8:58 pm - We've got a potential new record-holder for the area with the lowest atmospheric pressure.

It's quite the fitting ending for 2020.

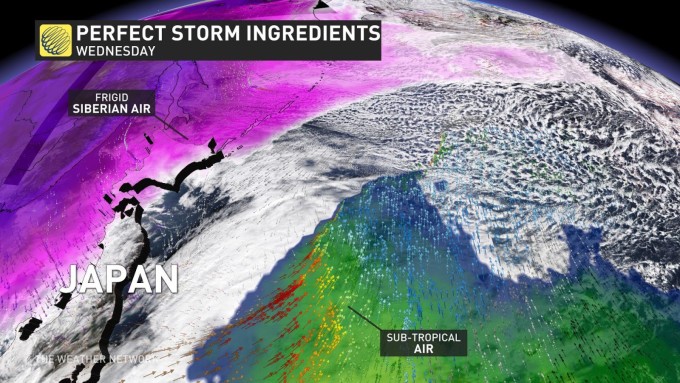
On Wednesday, a monster storm was born across the western Pacific and caused record-breaking cold temperatures to stream east across Japan.

The interaction of the frigid air mass and a powerful Pacific jet stream allowed for the beginning of rapid intensification. As the Siberian air flowing across the western Pacific interacts with a warmer, sub-tropical flow south of Japan, it will create the necessary conditions to push the atmosphere to the limit by Thursday.

Image 20201230 205845


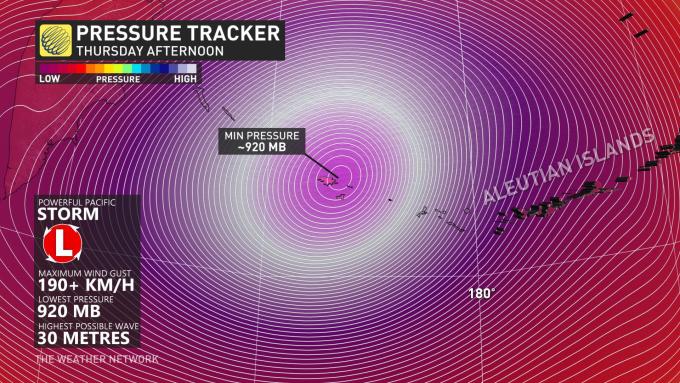
The storm statistics are jaw-dropping: Maximum winds will approach 200 km/h on the southern side of the low by Thursday and maximum individual wave heights are forecast to reach nearly 30 metres. The swell will propagate across the Pacific and there is the possibility that parts of western Vancouver Island could see 6 to 8 metre waves.

The lowest pressure ever recorded in the region is 924 mb. Computer models indicate that this system will be near this historic pressure threshold by Thursday evening as it pushes into the Bering Sea.

For reference, only two Atlantic hurricanes in 2020 had lower pressure readings, Hurricane Eta and Iota, although this comparison is apples to oranges.

Hurricanes extract their power from warm sea surface temperatures, while the extreme temperature gradients in the northern latitudes fuel the storms tracking across the Northern Pacific.

lowthursday


DOWNSTREAM IMPACTS ON CANADA

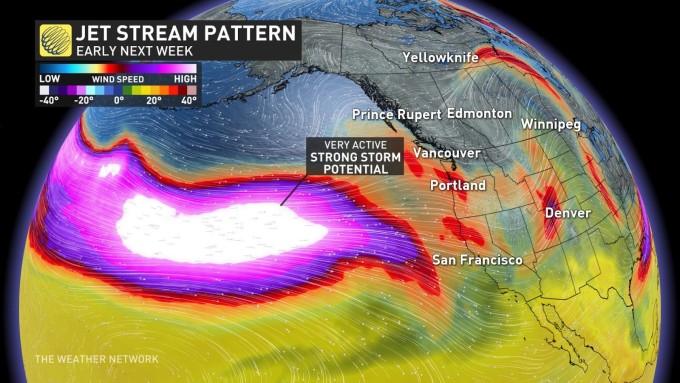
All of that energy traversing the Pacific Ocean will create some weather chaos across Canada. B.C. ski resorts will be measuring snowfall, not in centimetres, but in metres in the days and weeks to come.

Image 20201230 205910

The strong jet stream that creates intense storm conditions for British Columbia will keep the rest of the continent void of any consistent Arctic air through mid-January.


The Weather Network - Strongest low in the world heading towards Alaska
 

OldArcher

Has No Life - Lives on TB
Doesn’t it, to you, look like the weather is different from recent years past? Doesn’t it look like this Winter will be more arduous than the last few years?

Talk has been rife, concerning the GSM, and also, the potential for an oncoming Ice Age...

Amazing what modern technology can show us... Prepare for the worst, hope for the best, and never, ever, give-in to survivor guilt...

OA
 

northern watch

TB Fanatic
2020 will end with a spectacular “Day After Tomorrow” extratropical event, as one of the most intense North Pacific storm on record heads straight for the Aleutian Islands
By Marko Korosec | Global weather | 31 December 2020
Servere Weather Europe

The North Pacific sees no rest this winter. And now, the weather has decided to challenge the all-time pressure record for the region. The combination of the deep Arctic cold over Siberia, the advection of a warm Pacific tropical air mass, and the extremely powerful 250 mph jet stream separating these two air masses is resulting in an *explosive* extratropical storm with its central pressure forecast to bottom out near 920 mbar and blast into the Aleutian Islands.

As we discussed in our previous article about the ongoing explosive extratropical storm south of the Aleutians today (Wednesday), the Northern Pacific has been extremely active this year and is brewing something more.
There were many intense mid-latitude cyclones (extratropical lows) lately and North Pacific is showing no signs of easing off anytime soon.

Thanks to the ongoing La Nina pattern, there is an above-average activity over the North Pacific with huge amounts of rain and snow for the Pacific Northwest of the United States and Canada. Actually, this is a typical La Nina pattern evolution.
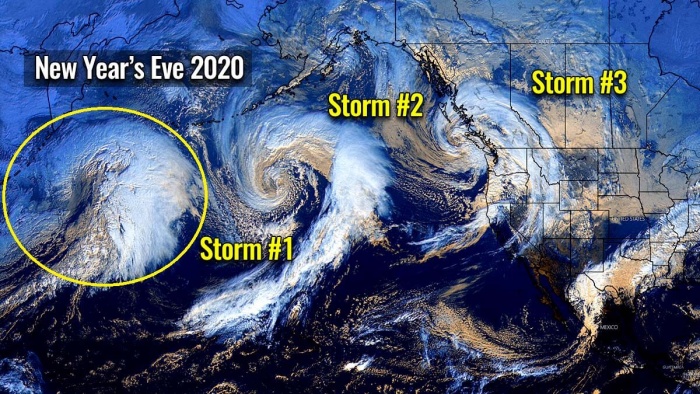
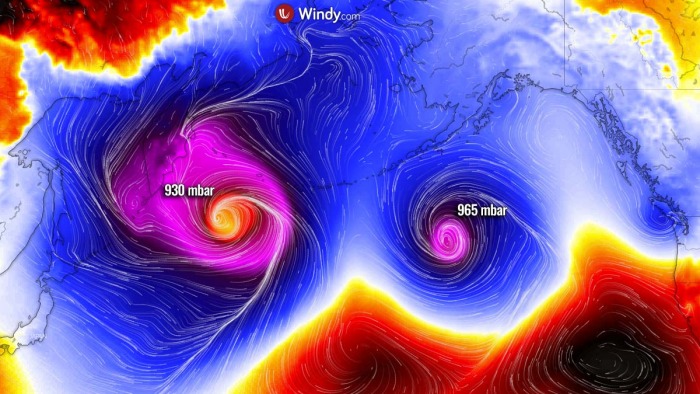
And to make all this even more interesting, there are now three extratropical storm systems simultaneously ongoing in the North Pacific.

pacific-record-breaking-extratropical-storm
Image is provided by Windy.com

This new storm we are featuring in this article has started near Japan on Tuesday and has been steadily strengthening since then. And since this Wednesday morning, it has entered an explosive intensification, arriving at the south of the Kamchatka Peninsula.
The system is heading straight for the Aleutian Islands and the Bering Sea for the last day of the year, right for New Year’s Eve 2020. It will graze across the westernmost islands of the Aleutians with extremely powerful life-threatening hurricane-force winds and major destructive waves.


pacific-record-breaking-extratropical-storm-twin-cyclone
Image is provided by Windy.com

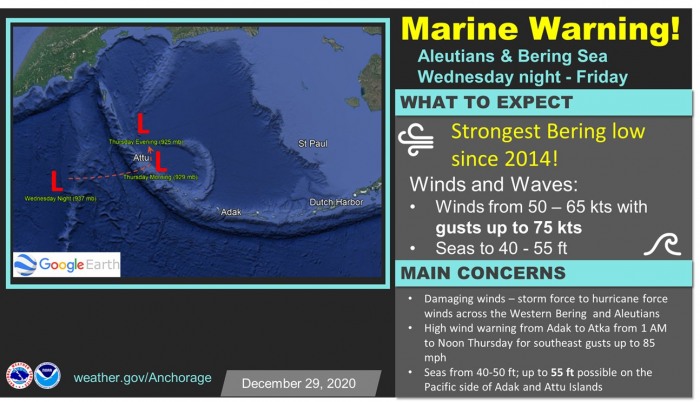
According to the National Weather Service in Alaska, this extratropical storm will be the strongest Bering Sea low since 2014 when the remnants of Super Typhoon Nuri blasted through.

We’re saying goodbye to 2020 with the strongest Bering low since Typhoon Nuri in 2014! Waters near the Aleutians can expect hurricane-force winds and seas between 40 & 50 ft! A High Wind Warning has been issued from Atka to Adak for wind gusts up to 85 mph Thursday morning.

pacific-record-breaking-extratropical-storm-alaska-warning
There is very high forecast confidence that a deep and very powerful low-pressure system will move into the Western Bering Sea starting

Wednesday evening. Based on the various model guidance, the system will likely have a minimum central pressure of less than 925 mbar, which would be one of the deepest storms in the Bering Sea since Nuri.

This extratropical storm will bring a broad area of hurricane-force winds to most of the waters west of Unalaska and the Pribilof Islands beginning Wednesday evening through Friday.

In addition to hurricane-strength winds, the monster storm is predicted to kick up significant wave heights, potentially with waves in excess of 50 feet to nearly 55 feet (17 meters) on the Pacific side of the Aleutians from Adak to Attu Island on Thursday. Those could be destructive for the coast.

End of Part 1

2020 will end with a spectacular "Day After Tomorrow" extratropical event, as one of the most intense North Pacific storm on record heads straight for the Aleutian Islands (severe-weather.eu)
 
Last edited:

northern watch

TB Fanatic
Continuation from Post 2328

BOMB CYCLONE TO ITS FINEST

The background leading to this storm’s evolution and its potential to challenge the all-time Alaska and Bering Sea pressure record, is an impressive, frigid cold with below -55 °C spread across parts of Siberia, Russia in these final days of 2020, rushing eastward towards Japan and the Northwest Pacific Ocean.

As this deep and extreme cold Arctic air mass interacts with a strong Pacific jet stream, the result is yet another violent extratropical storm.

And it will not be just another intense storm in line, but very likely it could become the most intense Earth’s storm of the year! Actually, the potential is there for a new record-holder storm for the area with the lowest atmospheric pressure ever recorded. For both Alaska (926 mbar) and the Bering Sea (924 mbar)!

pacific-record-breaking-extratropical-storm-zoom-pressure
Image is provided by Windy.com

This new storm is taking almost the same track as the last extratropical storm a few days ago. It will graze across the southwestern portions of the Aleutian Islands with extremely powerful winds and 50+ feet waves.

Its intensification rate will be so intense, that its central pressure fall will be more than double the threshold for a bomb cyclone*. Weather model guidance hints more than 60 mbar pressure drop within 24 hours period from Wednesday morning into Thursday morning.

Evolution of the most intense North Pacific storm on record

*Bomb cyclone or a bombogenesis is a meteorological term that describes a mid-latitude cyclone (a so-called extratropical low or storm) that rapidly intensifies. Both with winds and indeed its central pressure.

The bombogenesis process occurs when an extratropical storm rapidly intensifies, dropping its central pressure at least 24 millibars over 24 hours period. A millibar measures atmospheric pressure. This can happen when a cold air mass collides with a warm air mass, such as air over warm ocean waters, and leads to an explosive strengthening of the storm.

The formation of this rapidly strengthening weather system is a process called bombogenesis, which creates what is known as a bomb cyclone.

STORM COULD CHALLENGE THE ALL-TIME RECORD

Forecast confidence is very good that the last storm of 2020 could be extremely dangerous and has the potential to become one of the strongest North Pacific, the Aleutians, and the Bering Sea extratropical storms on record.

The storm’s central pressure is forecast to bottom out at an exceptionally low pressure below 925 mbar. The all-time low pressure ever recorded in Alaska remains a 926 mbar record from at Dutch Harbor on October 25th, 1977, according to meteorologist dr. Jeff Masters.

This storm could definitely challenge the Bering Sea lowest pressure record of 924 mbar and Alaska’s 926 mbar record!
The last time such a violent extratropical storm hit the Aleutian Islands, Alaska, and the Bering Sea were the remnants of Super Typhoon Nuri and this storm now could challenge that. If model forecasts for the minimum central pressure verify, we could be seeing one of Earth’s strongest storms on record on Thursday, Dec 31st.

pacific-record-breaking-extratropical-storm-nuri

For your reference, only two storms in the 2020 Atlantic hurricane season had lower pressure readings that this storm’s pressure is forecast. Category 5 hurricane Iota had its minimum central pressure of 917 mbar while Hurricane Eta peaked as a Category 4 with 923 mbar. Both storms were moving across the Caribbean Sea in November.

And indeed this is absolutely not a good way to compare the strength of tropical and extratropical storms. Hurricanes are fueled by extremely warm sea temperatures, while the extreme temperature gradients (air mass coming from the Arctic region) in the northern latitudes fuel the extratropical storms over the North Pacific or far North Atlantic.

But just to give you an idea of how extremely low pressure can go in these systems, no matter if they are tropical or extratropical storms.

Now, let us dig into the most important details with the extratropical storm evolution on its way for the Aleutian Islands.

HOW WILL THE STORM ACTUALLY DEVELOP AND WHY?

According to weather expert Michiel Baatsen, assistant professor at Utrecht University, a very impressive and remarkably textbook case of explosive cyclogenesis was taking shape over the Northwest Pacific Ocean on Tuesday. The low was analyzed over Japan at 12z Tuesday (Dec 29th) with a central pressure of about 1008 mbar.

And its pressure drop is going to reach around or even below 925 on Thursday morning, so about 80 mbar over the roughly 36 hours when reaching the Aleutian Islands.

Baatsen explains the background process on the storm’s evolution:

How come such an intense cyclone can form in the current situation and how will it manage to keep deepening rapidly for over 2 days? The answer lies in the air masses clashing over the region and the dynamics overhead:
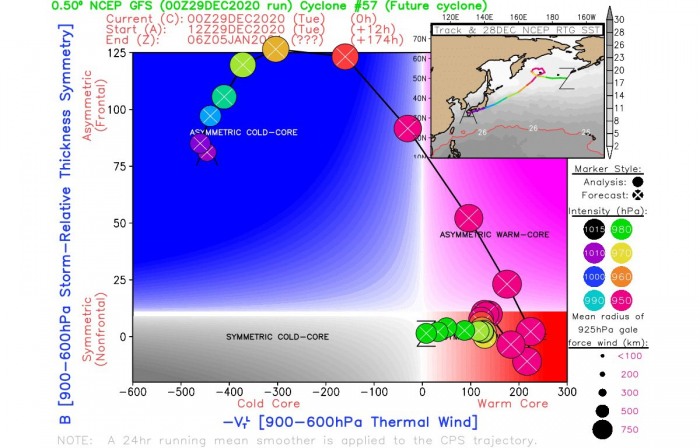
  • Deep arctic air originating over Siberia (where some -50 °C temperatures were recorded recently) will meet tropical air advected from the Western Pacific warm pool (where the ocean surface is at around 30 °C year-round). The gradient taking shape in between is reflected well by the asymmetry parameter getting literally off the chart in cyclone phase space diagrams.

pacific-record-breaking-extratropical-storm-warm-core
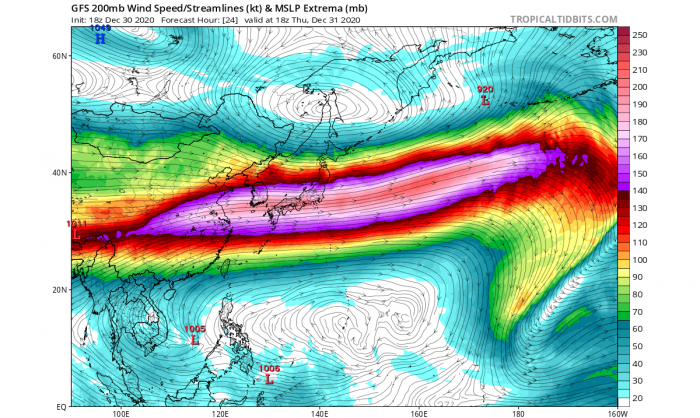
  • An exceptionally powerful jet stream in the upper troposphere (100-110 m/s at 200-300 hPa, which is 10-12 km above the surface) separating the two air masses. The geography of Central/Eastern Asia favors the merging of the otherwise mostly separated polar and subtropical jet streams (as seen in the vertical cross-section).
pacific-record-breaking-extratropical-storm-jet-stream
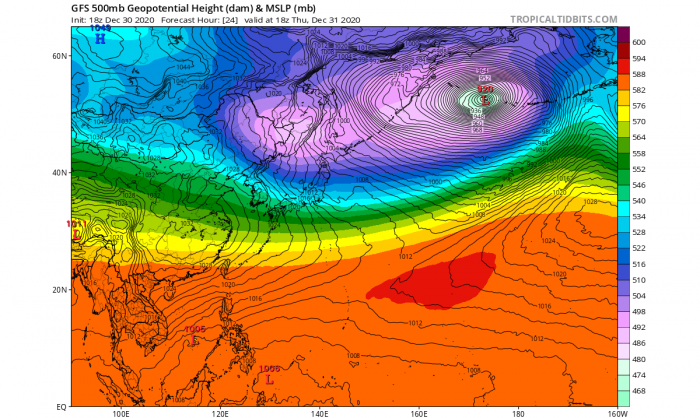
  • The cyclone forms in a region of very favorable upper-level divergence, underneath a combined left exit and right entrance regime of two jet streams. It then interacts with the strengthening upstream jet streak and moves in sync with its left exit region, meaning that the system keeps deepening until it slows down and the interaction becomes unfavorable.
pacific-record-breaking-extratropical-storm-500-mbar-chart
  • The transition between upper-level configuration also means that the system will likely acquire a somewhat hybrid structure; starting off following the Shapiro-Keyser (i.e. seclusion) conceptual model but in time moving more towards that of the Norwegian School (i.e. occlusion).
*VERY* RAPID INTENSIFICATION UNDERWAY

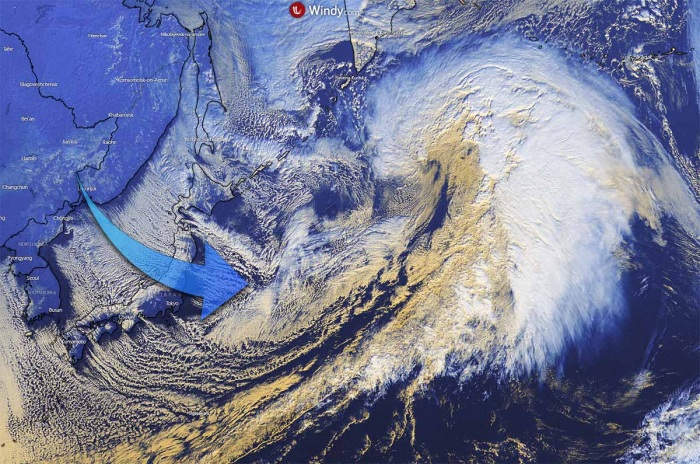
The intensification of this extratropical North Pacific storm is at an extreme rate this Wednesday. Its strengthening has begun on Tuesday while emerging near Japan with the very cold Arctic air mass blasting into the Northwest Pacific from the Russian Siberia.

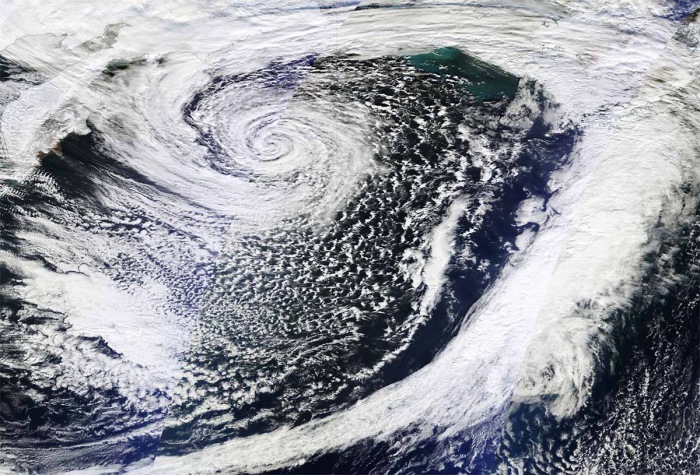
pacific-record-breaking-extratropical-storm-visible-satellite
Image is provided by Windy.com

The cyclone has already deepened to 960 mbar as of 18 UTC Wednesday, with a deeping pressure of around 10-15 mbar per 6 hours period. The system is already become an impressive monster storm and is not even close to its peak intensity.

The wide visible satellite channel view above reveals a very cold air mass spreading over Japan, with typical convective cloud rolls spreading snow squalls towards Japan, known as sea-effect snowfall. This will generate a massive snowpack over parts of Japan, locally close to 1 meter (100 cm) of fresh snow!

There is also a textbook appearance of an explosively strengthening extratropical storm and a well-defined dry intrusion visible, being pushed into the storm from the southwest.

pacific-record-breaking-extratropical-storm-airmass-satellite

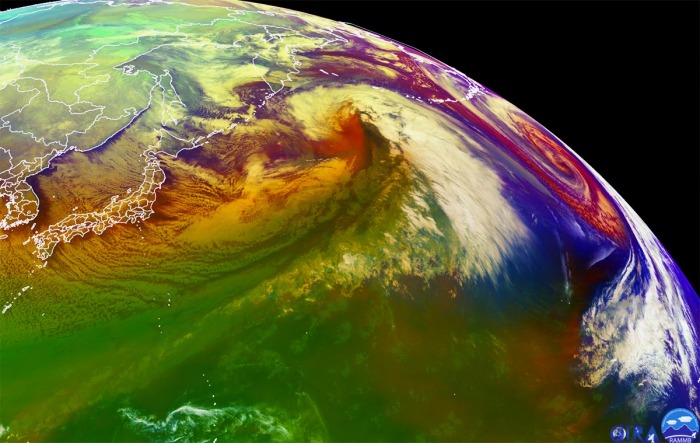
The above image is another satellite view, provided by CIRA/RAMMB NOAA. It shows a perfect example of the dry conveyor belt pushing into the storm’s core. The evolution of both storms is pretty remarkable. Notice also another spectacular storm on the far east, that’s the storm south of the Aleutians today.

pacific-record-breaking-extratropical-airmass

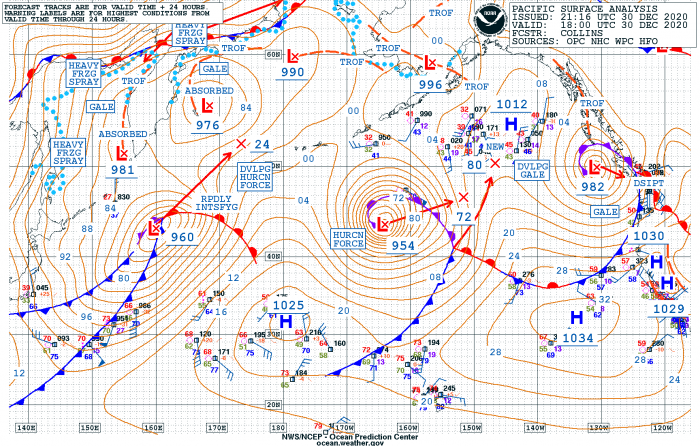
Further down is the surface data analysis for the estimated mean sea-level pressure by the NOAA Ocean Prediction Center (OPC).

The surface pressure analysis shows this extratropical storm evolution from its birth near Japan on Tuesday, entering the explosive intensification while gradually growing its size and rapidly lowering its central pressure through Wednesday:
  • 960 mbar at 18 UTC, Dec 30th
  • 972 mbar at 12 UTC, Dec 30th
  • 986 mbar at 06 UTC, Dec 30th
  • 996 mbar at 00 UTC, Dec 30th
  • 1001 mbar at 18 UTC, Dec 29th
  • 1008 mbar at 12 UTC, Dec 29th
As we can see from the pressure analysis above, the central pressure in this extratropical storm had an impressive 26 mbar pressure fall over the last 12-hour period and 41 mbar pressure change over the last 24 hours, between Tuesday 18 UTC and Wednesday 18 UTC.

pacific-record-breaking-extratropical-storm-analysis

This is nearly double the threshold for bombogenesis, while the storm is now intensifying at an even faster rate. It is expected to deepen for another 35-40 mbar over the next 24 hours!

The system continues moving towards the northeast of Japan and to the south of the Kamchatka peninsula, directly for the impact on the Aleutian Islands on Thursday.

Heading straight for the Aleutian Islands and the Bering Sea and is expected to graze across them for New Year’s Eve 2020. Its center will pass across the westernmost islands of the Aleutians with extremely powerful winds and major near 50-55 feet waves.

And if the weather model guidance verifies with the pressure to fall below 925 mbar on Thursday, the system is definitely challenging the all-time record for the North Pacific region.

TWIN STORMS OVER THE NORTH PACIFIC

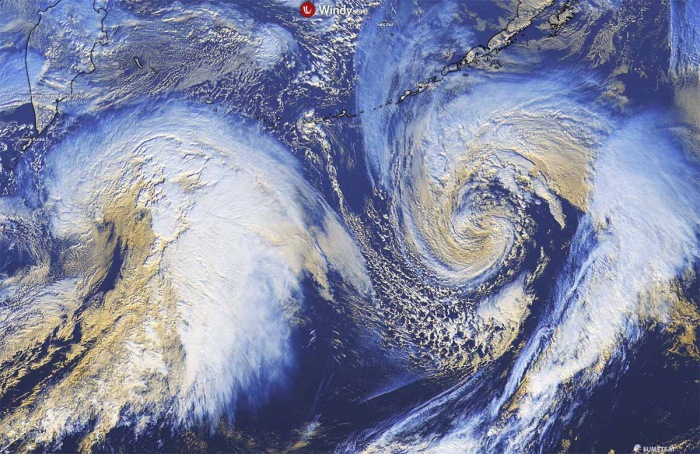
While the storm is moving towards the Aleutian Islands, the second storm to its right is still very intense. And both are creating an impressive twin-cyclone tandem over the North Pacific. The eastern storm (right), however, is weakening while the main featured storm is explosively intensifying (left).

pacific-record-breaking-extratropical-storm-satellite-twins
Image is provided by Windy.com

The tandem of storms are separate systems, so not interacting with each other. But are both impressive on the satellite view. An obvious difference in their strength is quite easy to judge, as the new storm (left) looks like the mother of all storms.

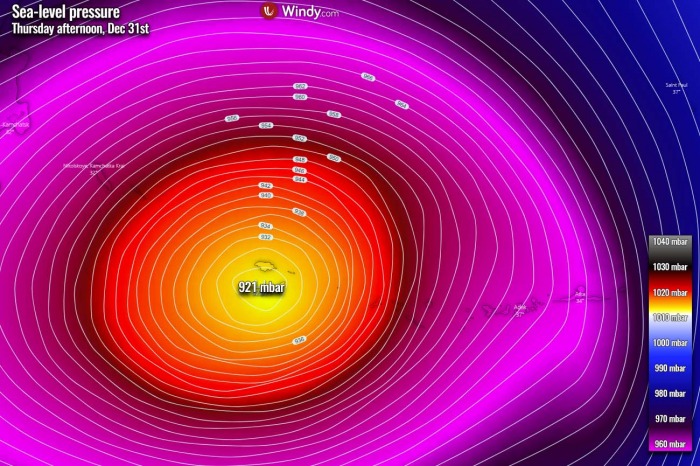
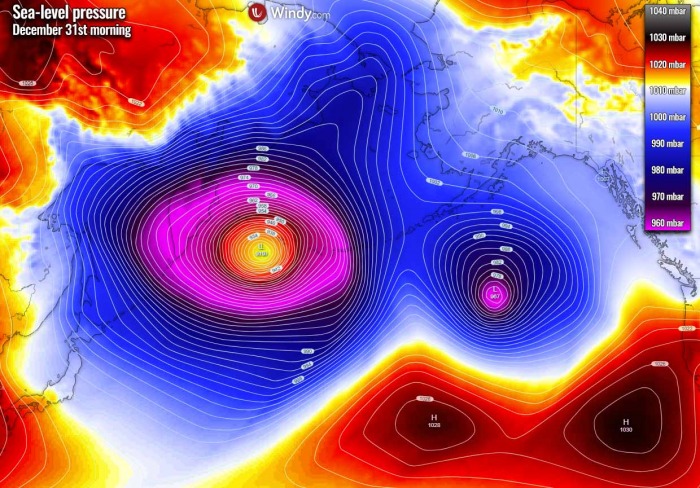
Attached is the GFS model simulation for the central pressure and we can see it hints at 919 mbar! And also the ECMWF model is not far behind, so we can confidently expect the low will reached well below 925 mbar at its peak.

pacific-record-breaking-extratropical-storm-pressure-thursday
Image is provided by Windy.com

It is forecast to pass across the westernmost Aleutian Islands right for New Year’s Eve 2020. Maintaining its central pressure around 925 mbar or even lower. This will be very near or even lower than existing Alaska’s historic record of 926 mbar from at Dutch Harbor on October 25th, 1977.


pacific-record-breaking-extratropical-storm-pressure-new-years-evening
Image is provided by Windy.com

HURRICANE-FORCE WINDS AND 50+ FEET WAVES FOR ALEUTIANS

The main impact of this extratropical storm will be the rough power of destructive winds, and indeed the significant wave heights.

Violent winds are developing across the southern portions of the storm, with the forming sting jet wind maximum. These winds are very likely to reach up to near 200 km/h (125 mph) while the low will be nearing the Aleutian Islands by Thursday afternoon and evening hours.

pacific-record-breaking-extratropical-storm-winds

Image is provided by Windy.com

Although the strongest winds might vanish until the storm reaches the Aleutians, its huge wind swath will blast across the western half of the Aleutian archipelago. The peak gusts could reach 120-150 km/h, generating major waves with significant height above 15 meters (50 feet).

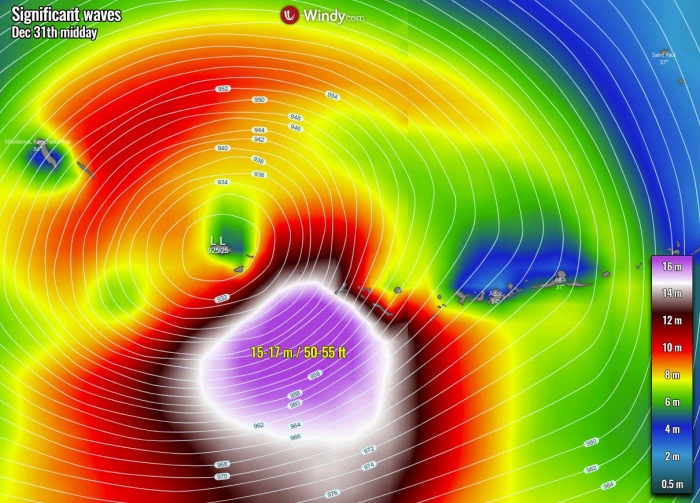
pacific-record-breaking-extratropical-storm-waves-midday
Image is provided by Windy.com

The highest waves will reach up to 17 meters (55 feet) and will be located to the immediate southeast of the storm’s center while it passes across the Aleutians. The blast to the islands will be extremely dangerous and life-threatening. And could also be destructive!

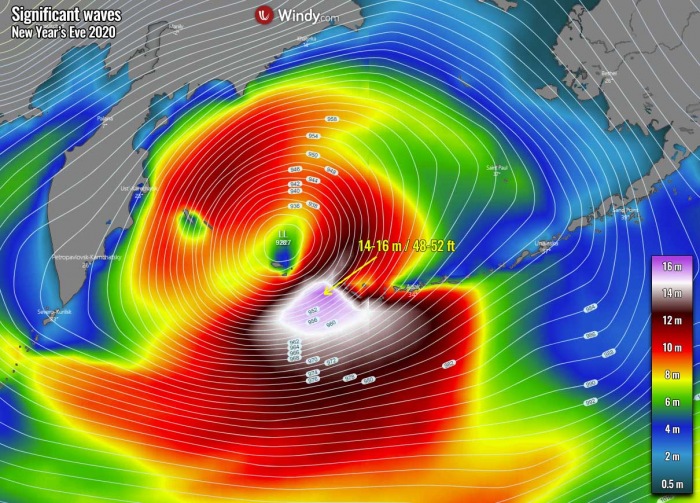
Storm then continues into the southern Bering Sea, remaining extremely intense and keep pushing major near 50 feet (15 meters) waves into the Aleutians. Huge waves will also generate across a large part of the Bering Sea, thanks to the size of this monster storm.

pacific-record-breaking-extratropical-storm-waves-new-years-evening
Image is provided by Windy.com

And this will definitely be the New Year’s Eve to remember. If the system does challenge the all-time Alaska (or Bering sea) records, it will be known soon as it passes, as pressure data are measured on the weather stations by the National Weather Service in realtime.

The existing lowest pressure record for the North Pacific by any extratropical storm since records began is held at 924 mbar, recorded on Nov 8th, 2014 over the Bering Sea.
Stay tuned!

Part 2 of 2

2020 will end with a spectacular "Day After Tomorrow" extratropical event, as one of the most intense North Pacific storm on record heads straight for the Aleutian Islands (severe-weather.eu)
 
Last edited:

northern watch

TB Fanatic
Ocean analysis reveals 2 anomalies that will impact weather development as we head into the new year, influencing the USA tornado season and Summer in Europe

By Andrej Flis | Long range / seasonal forecast | 28 December 2020
Servere Weather Europe

Ocean and Atmosphere are strongly related and interconnected. Together they form the basis of our complex climate system. Current trends in the Ocean temperature anomalies indicate a potentially important effect on the Severe weather season in the United States and even Summer in Europe.

Global oceans cover 71% of the Earth’s surface and contain 97% of the Earth’s water. They play a crucial role in global atmospheric circulation and climate, impacting our weather in a major way.

First, we will look at the global ocean temperature anomalies. This easily shows us where in the ocean the waters are warmer/colder than the long term average (1982-2010).

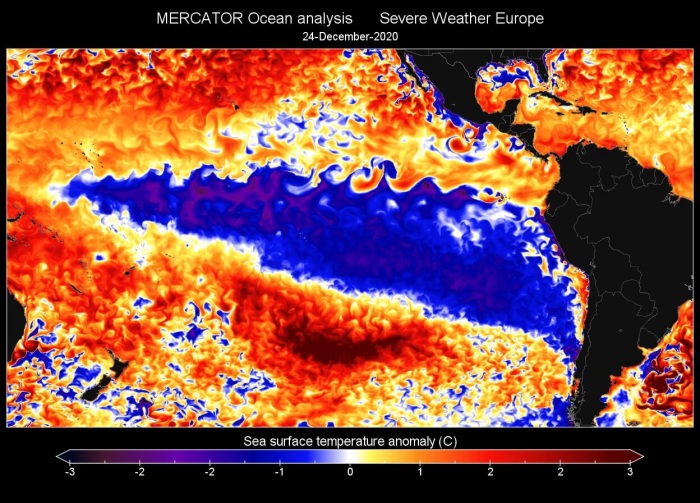
We can see in the image below, that much of the globe has above-average ocean temperatures. What stands out is the ENSO region, with its cold La Nina phase currently ongoing.

Another feature that stands out, is the warmer than normal North Pacific ocean. Especially the eastern side, with its unofficially named “warm-blob”.

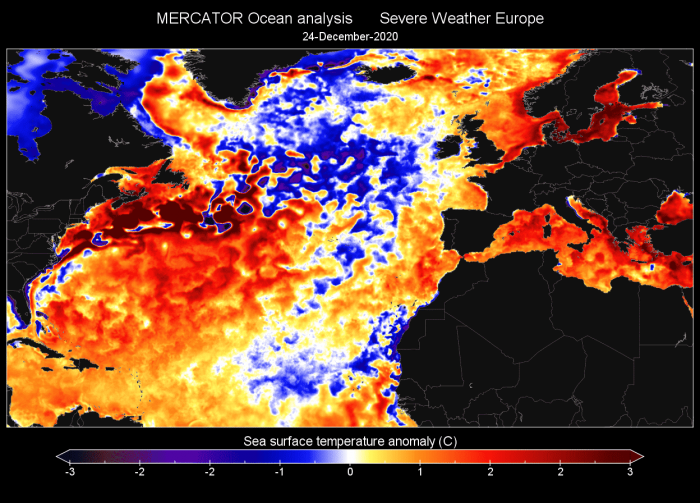
Also important is the North Atlantic ocean. The far northern regions are colder than normal, with the Gulf stream region running abnormally warm.

global-ocean-temperature-analysis-for-weather-forecast-europe-united-states-winter-spring-summer-2021
We produced a high-resolution video of the developing ocean temperature anomalies in the North Pacific and the North Atlantic. It shows that the ocean temperature profile is constantly changing, being largely impacted by the weather pattern and especially the winds.

Looking at the average ocean anomalies for the entire year 2020 so far, we can see all three features standing out. We have the warm blob in the North Pacific, the cold tropical ENSO region, and the cold-neutral North Atlantic.

global-ocean-temperature-analysis-2020-weather-forecast-europe-united-states

NORTH ATLANTIC OCEAN

Looking closer at the North Atlantic, we can see a fairly large area of colder than normal ocean temperatures in the subpolar regions. This is largely due to the cyclonic/low-pressure weather activity in this region and the resulting positive NAO during the late Autumn season.

north-atlantic-ocean-temperature-analyis-and-weather-influence
As a quick explanation, the NAO stands for North Atlantic Oscillation. It simply describes the mode of the pressure difference between the Icelandic Low-pressure and the Azores High-pressure systems.

The image below shows the difference in weather between the two NAO phases. A higher pressure difference between Iceland and the Azores (positive NAO) can mean a stronger westerly jet stream and a more mild Atlantic airmass reaching mainland Europe, and warmer weather in the eastern United States. A lower or reversed pressure difference between Iceland and the Azores (negative NAO), means a more north-south flow and a higher chance of colder weather over Europe and the eastern United States.

north-atlantic-oscillation-weather-influence-europe-united-states
The pressure anomaly on the image below reveals the pressure pattern from Nov 1st to Dec 23rd. It shows lower than normal pressure over the subpolar North Atlantic and Scandinavia, and higher pressure over central North Atlantic regions. This is essentially a variation of a positive NAO phase we have seen above.
north-atlantic-sea-level-pressure-anomaly-autumn-2020-europe-united-states
Constant strong cyclonic activity and cold fronts, tend to mix the ocean surface with deeper cooler waters, and also removing some of the heat from upper ocean layers, further cooling the ocean surface.

This is evident in the graphic below, which shows the North Atlantic temperature anomaly graph over time. It does reveal a very significant anomaly drop from October into November. That corresponds with the dominant positive NAO phase which began in November.

north-atlantic-ocean-temperature-anomaly-autumn-2020-europe-united-states
The image below shows the NAO index in the past weeks. We can see it was positive for most of November, going neutral into December. It nicely corresponds with the ocean temperature graph above, which shows the temperature going below normal as the NAo turned positive.


north-atlantic-oscillation-weather-index-nao

So, why is the temperature of the North Atlantic ocean important? Because there is a known connection between colder subpolar North Atlantic ocean temperatures and summer heatwaves in Europe.

Several scientific studies suggested that the cold North Atlantic ocean anomaly and the resulting temperature differences could have initiated a stationary Jet Stream position that favored the development of high pressure and temperature extremes over Central Europe.

To simplify, the winter/spring North Atlantic Ocean temperature anomalies can have an influence on the developing pressure patterns in summer, affecting the position of the jet stream, allowing higher pressure to build over Europe, causing strong heat waves.

Partially we also have to consider that the positive NAO pattern holds or transfers into summer, allowing for higher pressure to build over central Europe this way.

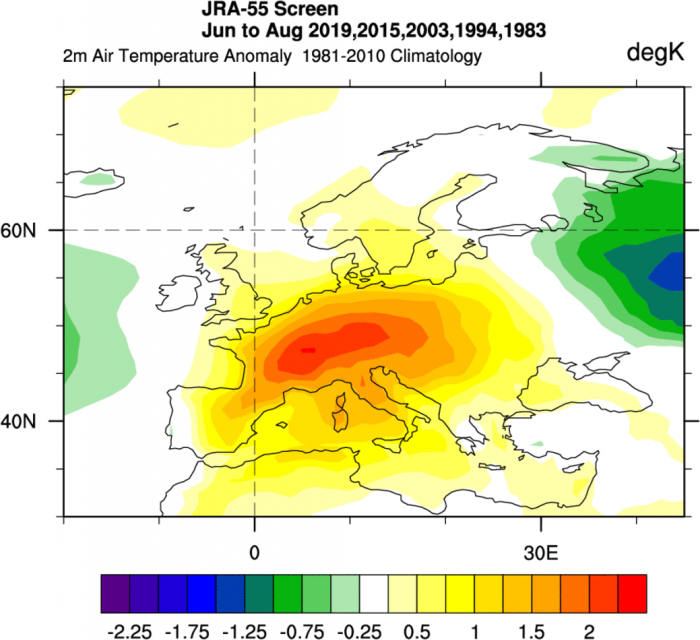
Below we have prepared two graphics. The first one shows temperature anomalies in summer, during the years with strong heat waves. We have 2019, 2015, 2003, 1994, and 1983. All these years featured strong heat waves during summer over parts of central Europe.

europe-weather-pattern-heatwave-temperature-anomaly-2020-2021
The second graphic shows the ocean temperature anomalies in spring, prior to these years with strong heatwaves. We can see a very similar picture to this year, with the cold subpolar North Atlantic, and warmer central North Atlantic regions.


north-atlantic-ocean-temperature-anomaly-heatwave-europe-united-states
Looking at the ECMWF long-range forecast, we can see that it continues the colder North Atlantic temperatures into Spring 2021. We can see a pretty significant temperature anomaly gradient between the subpolar North Atlantic and the Gulf Stream region.
ecmwf-ocean-sea-surface-temperature-forecast-spring-2021-europe-united-states
The surface temperature anomalies below actually reveal the colder air extending from the subpolar North Atlantic towards western Europe. This would imply a low-pressure extension towards northwestern Europe.

This would mean more southerly warmer flow for Eastern Europe, with cooler air over western Europe. Central Europe is in-between the two poles, with both occasional cold front from the west/northwest and warmer episodes with the southerly flow.

Over North America however, we can see a pretty significant positive temperature anomaly over the western United States and over the North Pacific.

spring-2021-weather-forecast-temperature-anomaly
It is too far to look out into actual Summer 2021 forecasts, but the trend of a colder than normal North Atlantic ocean is the first sign that points towards a potentially increased number/duration of summer heatwaves over Central Europe.

End of Part 1

Ocean analysis reveals 2 anomalies that will impact weather development as we head into the new year, influencing the USA tornado season and Summer in Europe (severe-weather.eu)
 

northern watch

TB Fanatic
Continuation from Post 2334

LA NINA – THE COLD ENSO PHASE

We have already covered ENSO and La Nina extensively in the past weeks and months. But the strong cold ENSO phase is now really starting to show its influence and will be one of the major weather factors in the coming weeks and months.

To simplify, ENSO is short for “El Niño Southern Oscillation”. This is a region of ocean in the tropical Pacific, which shifts between cold and warm phases. The tropical trade winds (easterly winds that circle the Earth near the equator) usually initiate or stop a certain phase, as they mix the ocean surface waters and change the ocean currents.

Below we have an image that shows all the ENSO regions, also called the Nino regions. The main ENSO regions are 3 and 4 and cover a large part of the tropical Pacific. But most calculations and analysis is based on a single region called Nino 3.4, which partially covers both regions, 3 and 4.

1_winter-weather-season-forecast-enso-global-regions
ENSO plays a major role in the tropical rainfall and pressure patterns and the complex interaction of the ocean-atmosphere system. Through this ocean-atmosphere connected system, the ENSO influence is distributed around the world.

We usually observe a global shift in pressure patterns during the emergence and duration of the ENSO phases, each having a unique impact on our weather during the changing weather seasons.

The next image below shows the correlation between the ENSO temperatures/phases and the surface temperatures around the world. A very simple way to explain this is to say that we are observing what happens to one variable when the other one changes. In this case, we are looking at the Winter/Spring temperature patterns compared to the ENSO values.

Positive values mean, that as the ENSO values go up, so do the surface temperatures. That is nicely seen in the tropical ENSO regions with a strong positive signal. A negative correlation signal means that as ENSO values rise (positive phase), the surface temperatures drop.


enso-global-weather-influence-surface-temperature-correlation

A practical example is the negative values in the southern United States and Mexico. It simply means that as ENSO gets warmer (positive phase) the temperatures there get lower than normal, as the weather patterns change in response to the changing circulation.

Another example is when we look at the correlation between ENSO and pressure patterns. We can see a large negative area in the eastern Pacific Ocean. This for example implies that as ENSO values rise (positive phase), the pressure there drops. It also means that as the ENSO values drop (negative phase), the pressure there rises.

enso-global-weather-influence-sea-level-pressure-correlation

The cold ENSO phase is called La Nina and the warm phase is called El Nino. The ENSO phase is determined by the temperature anomalies (warmer/colder) in the ENSO 3.4 region in the tropical Pacific that we showed at the start of this segment.

The image below shows the current analysis of ocean temperature anomalies and the quite extensive colder area in the tropical Pacific. That large triangular batch of colder than normal waters is the La Nina-

ENSO-tropical-ocean-temperature-anomaly-december-2020-weather-forecast


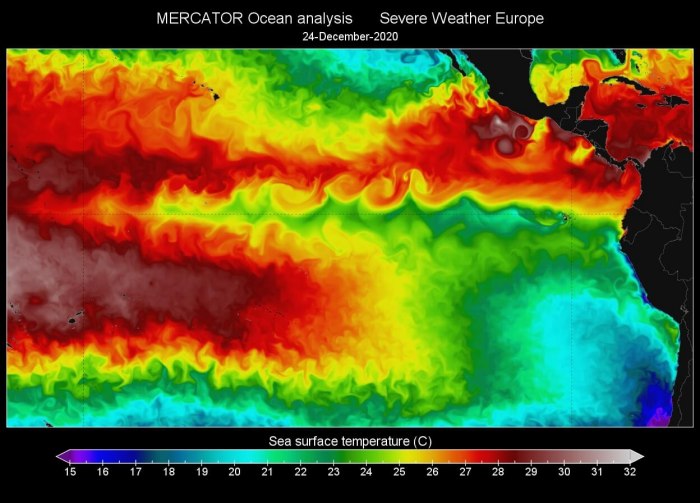
Raw temperatures also nicely show the La Nina, as an obvious colder (relative to the surroundings) water stream along the equator. The tropical trade winds blow from the east, and occasionally they get stronger and mix the ocean layers, bringing colder deeper waters to the surface, triggering a La Nina.

ENSO-tropical-ocean-temperature-december-2020-weather-forecast
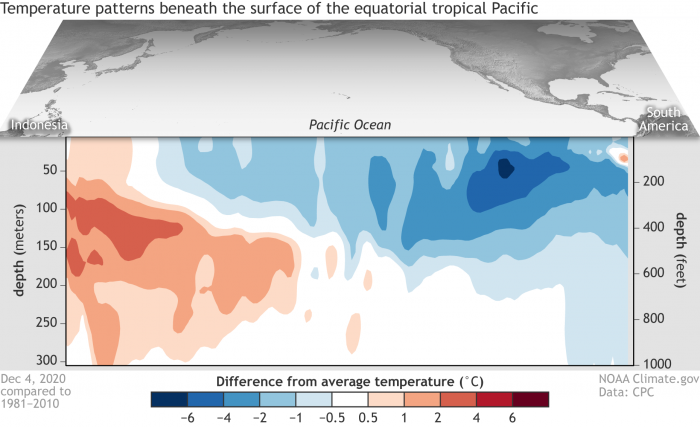
We can see the temperature anomalies below the surface in this analysis image from NOAA Climate. It shows quite colder waters lingering below the surface in the eastern tropical Pacific in early December. They were transported near the surface from deeper colder layers of the ocean, by the various wind and ocean transport processes.

ENSO-subsurface-ocean-temperature-anomaly-december-2020
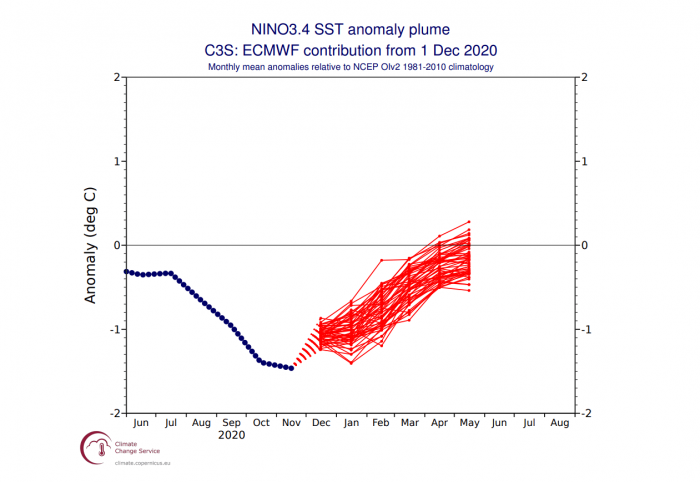
The anomaly graph over time shows that the La Nina is currently in the “strong” category, reaching the average anomaly of -1°C. It has reached below -1.5°C negative anomaly in late October and has weakened little since then.

enso-lanina-nino-3_4-ocean-temperature-anomaly-winter-2020-2021

The long-range forecasts currently indicate that La Nina has already reached its peak strength, and is expected to start weakening towards Spring 2021.

Below are two forecasts, from ECMWF and the Australian BOM, and they both show the temperature anomaly forecast for the main ENSO 3.4 region. La Nina is expected to start weakening in early 2021, but its influence will be far-reaching for quite a large portion of 2021.


ecmwf-enso-la-nina-nino-3_4-ocean-temperature-anomaly-forecast-winter-weather-spring-2021
enso-la-nina-ocean-temperature-anomaly-forecast-winter-weather-2021

WEATHER IN THE LA NINA WORLD

Tracking the infamous “La Nina influence” is not all that easy. It is not as simple to just point at a certain weather event and simply call it ENSO powered. Global weather is a very delicate system, where everything has an influence on everything. Tho at quite different “power levels”.

For example, it is quite simple to find evidence for direct La Nina or El Nino related weather patterns over the North Pacific or the United States in winter or spring.

But over Europe, the direct La Nina influence slowly fades, due to the generic weather pattern volatility. The influence is still there, but it is mitigated/modified by the existing weather patterns in the North Atlantic.

One way of searching for the “fingerprint” of the La Nina, is by looking at the atmospheric circulation, more specifically its angular momentum. Keeping it very simple, the Atmospheric Angular Momentum (AAM) is a measure of how the entire atmosphere rotates around the Earth. ENSO phases are strong enough to cause measurable changes in this atmospheric circulation around the Earth.

Positive anomalies are related to the positive phase of the ENSO, while negative values are more related to the negative ENSO phase, namely La Nina.

So far we saw positive values in early December, indicating a weak influence of the La Nina. But we are currently observing negative AAM values and still forecasted to drop further, indicating that the La Nina presence is potentially strong in the global circulation.


ENSO-global-weather-influence-winter-2020-2021-atmospheric-angular-momentum

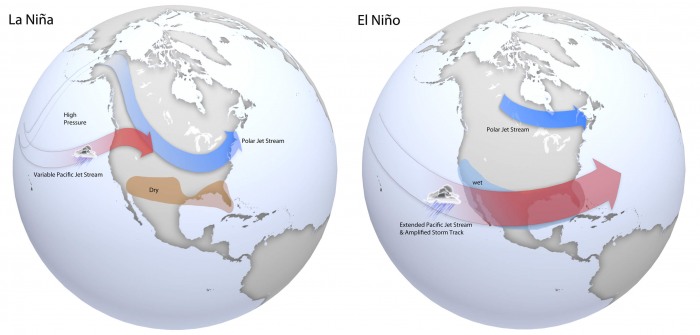
Both phases of the ENSO, warm and cold, have a unique influence on their own. Below is an image that shows the winter weather pattern over North America in El Nino (warm phase) and La Nina (cold phase).

Starting with La Nina winter, we can see it features a strong high-pressure system in the North Pacific. This actively bends the polar jet stream, turning it downwards toward Northwestern and northern United States, along with the colder air and snowfall. This keeps the southern United States relatively drier and warmer than normal.

In an El Nino winter, the North Pacific features a lower than normal pressure, amplifying the more southerly Pacific jet stream. This brings many low-pressure systems into the southern United States, featuring a cooler and wet winter in these regions. The northern United States usually experiences a milder winter on average during an El Nino.

weather-forecast-la-nina-versus-el-nino-winter
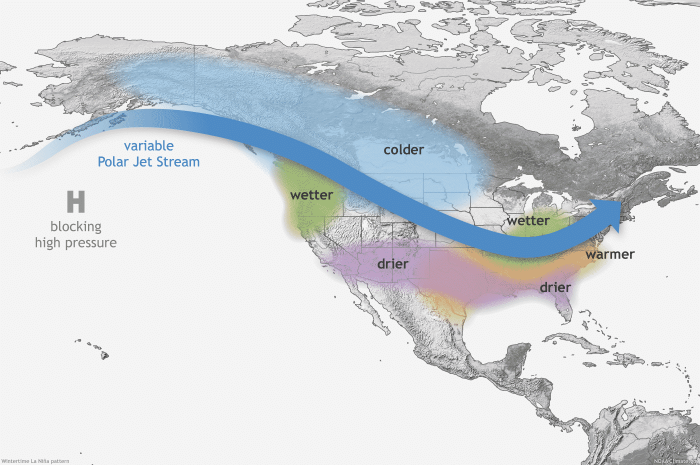
Below we have a closer look at a typical La Nina winter, with the temperature patterns emphasized. The twisted jet stream brings colder air and storms down from Canada into northern and the northwestern United States, and warmer and drier weather to the southern parts. The jet stream over the United States can actually divide the country into 2 different weather regions in any strong ENSO phase.

winter-weather-season-forecast-enso-la-nina-jet-stream-impact-united-states-canada


But, beyond winter, lies perhaps a more ominous weather threat from the La Nina. As proven with science over time, La Nina can have a profound influence on the Spring tornado season in the United States. And not in a good way.

Going straight to the point, we have a very interesting image below from NOAA Climate. It shows a very nice comparison of hailstorm and tornado frequency during the spring season in the United States, between El Nino and La Nina years.

It is quite shocking to see, that in a La Nina season, there is a substantially higher frequency of hailstorms and especially tornadoes in the southern and southeastern parts of the United States. It very profoundly outlines the central and eastern parts of the Tornado Alley.

ENSO-thunderstorm-hailstorm-tornado-influence-la-nina-el-nino-united-states-spring-season-forecast
Tornado Alley is a common nickname given to an area in the southern plains of the central United States that consistently experiences a high frequency of tornadoes and other severe weather each year.

But why are there more tornadoes and other severe weather in the southern United States during a La Nina?

It has a lot to do with the weather pattern we have seen earlier during a La Nina winter. We saw that it bends the polar jet stream towards the south, over the United States. Going towards spring, this effect can usually persist, as it can take some time to “remove” a decayed La Nina from the circulation system.

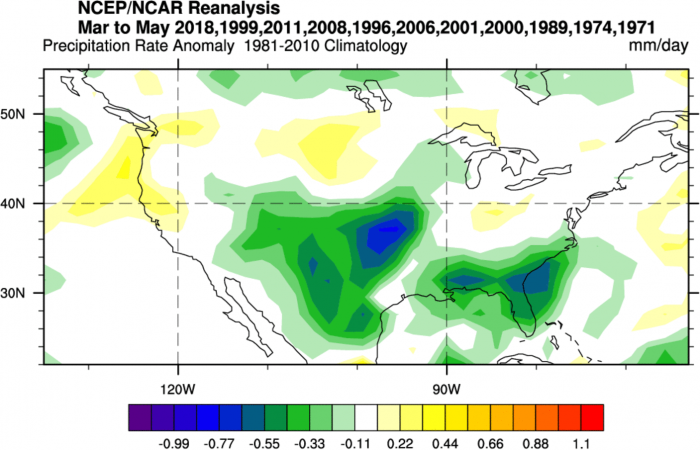
We produced simple reanalysis charts, which show the average La Nina spring weather pattern, based on the historic La Nina events in the past 40+ years. Note that there can be great variance between one La Nina season to another. The global weather system is very complex, and can sometimes interfere with the weather development in different ways, despite an active ENSO phase.

The first image shows the 500mb geopotential height anomaly, outlining the location of the main pressure systems. What is special about this chart is that we can see a large low-pressure area over western Canada and the northwestern United States.


la-nina-spring-weather-pattern-united-states-tornado-season
This can act as a source for frequent cold fronts moving from Canada down into the central United States, along with the jet stream, providing a lot of support and trigger mechanics for severe weather development.

But severe weather also needs an active source of energy, namely warm and moist air. That is usually sourced from the south, as far as the Gulf of Mexico.

The image below shows the surface pressure pattern, with a strong low-pressure anomaly in the south-central United States. A low-pressure system spins counter-clockwise, which means that on this map, this low-pressure area promotes strong southerly flow on its eastern side. That is directly from the Gulf of Mexico, towards the central and eastern parts of the Tornado Alley.

ENSO-thunderstorm-hailstorm-tornado-influence-la-nina-el-nino-united-states-spring-season-pressure-forecast
The precipitation anomaly chart shows the above-normal rainfall in the southern United States, especially in the hearth of the Tornado Alley. Together with the presence of the polar jet stream and the low-pressure systems, this is a clear indicator that a typical La Nina spring can be very violent with severe weather in the southern and eastern United States.

ENSO-thunderstorm-hailstorm-tornado-influence-la-nina-el-nino-united-states-spring-season-precipitation-forecast


Current combined long-range forecasts for Spring 2021 show that a very classic looking weather pattern is setting up. It is still very early to speculate, and we need to wait for the January 2021 updates for anything specific. But the early forecast does show that the severe weather season in Spring 2021 could be amplified by the current La Nina cycle.

spring-2021-long-range-weather-pressure-pattern-forecast-europe-united-states
Another concerning factor along with the pressure anomalies is the signal for warmer than normal sea temperatures in the Gulf of Mexico. This can provide warmer air with more moisture, potentially increasing the available energy for severe weather development in the southern United States.

spring-2021-long-range-weather-forecast-ocean-temperature

All in all, the chances are increasing for the severe weather season in the United States to be more active than normal, due to the La Nina influence. We will keep you updated with fresh info and weather forecasts as new data is available.

End of Part 2 of 2

Ocean analysis reveals 2 anomalies that will impact weather development as we head into the new year, influencing the USA tornado season and Summer in Europe (severe-weather.eu)
 
Last edited:

northern watch

TB Fanatic
From: Ocean analysis reveals 2 anomalies that will impact weather development as we head into the new year, influencing the USA tornado season and Summer in Europe

The image below shows the difference in weather between the two NAO phases. A higher pressure difference between Iceland and the Azores (positive NAO) can mean a stronger westerly jet stream and a more mild Atlantic airmass reaching mainland Europe, and warmer weather in the eastern United States. A lower or reversed pressure difference between Iceland and the Azores (negative NAO), means a more north-south flow and a higher chance of colder weather over Europe and the eastern United States.

north-atlantic-oscillation-weather-influence-europe-united-states
The pressure anomaly on the image below reveals the pressure pattern from Nov 1st to Dec 23rd. It shows lower than normal pressure over the subpolar North Atlantic and Scandinavia, and higher pressure over central North Atlantic regions. This is essentially a variation of a positive NAO phase we have seen above.

Then I noticed from 2014-07-24-Nick-Klingaman-year_without_summer_jet_stream.png (1309×984) (reading.ac.uk)

2014-07-24-Nick-Klingaman-year_without_summer_jet_stream.png


The Negative NAO phase is very similar to the Summer of 1816 jet stream pattern

If we see the Negative NAO phase, we are in for a world of cold.

NW
 

northern watch

TB Fanatic
I am reposting the following which I believe was posted in the original thread.

Floods, Famine, Frosts … and Frankenstein
Posted on 28 July, 2014 by Stephen Burt
By Nicholas Klingaman

No one who lived through the extreme climate of 1816 understood what caused the months of seemingly endless rain in Europe, the June snowstorms in New England or the severe drought in the eastern U.S. that convinced many farmers to sell their land and move west. All they knew was the weather was against them. Many blamed God: religious revivals intensified in America, while in Europe, self-described prophets foretold the coming apocalypse. Others invoked natural forces:
earthquakes, sunspots, icebergs, deforestation and changes in the Earth’s magnetic field. Meteorology was in its infancy – the first reliable weather forecasts were more than 130 years away – so few contemporary scientists could comprehend the changing conditions.

The true cause of “The Year Without Summer”, as 1816 would become known, lay halfway around the world on Sumbawa, an island near Java in Indonesia. Mount Tambora erupted in April 1815 with such force that British soldiers several hundred kilometres distant on the island believed they were under assault from enemy cannons. The eruption was one of the four strongest of the last 10,000 years, 100 times more powerful than the 1980 eruption of Mount Saint Helens in the US. Within 24 hours, the ash cloud covered an area the size of Australia. In Indonesia, 70,000 – 90,000 people died in the eruption and its aftermath, most from famine after the ash poisoned crops.

For the climate, the eruption’s height was more important than its power. Tambora’s plume of ash and gas extended more than 25 kilometres into the atmosphere, reaching the stratosphere. When volcanic plumes are limited to the troposphere (below 15-20 kilometres), rain droplets remove the ash, dust and sulphuric acid within weeks. Clouds rarely reach the dry stratosphere, however, so particles can remain for years before they grow large enough to fall. Tambora threw about 55 million tons of sulphur dioxide gas into the stratosphere, where it formed more than 100 million tons of sulphuric acid. Within months, strong stratospheric winds dispersed the acid droplets around the globe.

Because the droplets reflected and scattered sunlight, they may have appeared as a thin veil or haze, barely perceptible to the naked eye. Many never noticed it. The veil reflected only one half of one percent of the sunlight across the globe, but that cooled the average global temperature by 1-2ºC, making 1816 the second coldest year in the last millennium, after 1601 (which was also due to a volcanic eruption). Our planet’s climate is finely balanced: small changes in the input and output of energy can dramatically alter weather patterns, magnifying impacts on human life and the environment.

Western Europe and eastern North America cooled much more than the global average — at least 3ºC — because the falling temperatures altered the path of the Atlantic jet stream, the “conveyor belt” of winds that steer storm systems. The summer jet stream normally flows north-east from the Gulf of Mexico, bringing warm, humid air to the U.S. east coast and keeping most of Europe fairly dry (see Figure 1). In 1816, however, the jet stream slowed and developed “U”-shaped bends, winding its way north and south instead of east and west.

2014-07-24-Nick-Klingaman-year_without_summer_jet_stream.png


Figure 1. Displacements in the polar jet stream during summer 1816.

Instead of mild Gulf air, New England suffered cold Arctic blasts from Canada. As much as 30 cm of snow fell during a powerful early-June storm. Ground frosts plagued the region throughout the summer. Without summer thunderstorms to bring rain, crops failed in a drought that continued through autumn. In western Europe, the jet stream dipped far south, bringing a succession of strong wind and rain storms more typical of autumn and winter than summer. The wet and cold weather triggered a typhoid epidemic in Ireland, the first in the western world, that killed more than 60,000. In Switzerland, it rained on 130 of 152 days between April and August. Flooded rivers created thousands of refugees, who roamed from town to town in search of food and charity, finding little of either. Trapped indoors by the relentless poor weather, the novelist Mary Shelley, her poet husband Percy and their friend and fellow poet Lord Byron told ghost stories to one another, a popular pastime of the day. It was there, surrounded by the dark, gloomy conditions, that Mary conceived the idea for Frankenstein.

Many governments reacted slowly to the mounting catastrophe. Fearing that a spike in grain prices would trigger a revolt, and mindful of the recent French Revolution, European governments restricted grain exports and suppressed news of poor harvests. Neither policy helped. Eventually, they were forced to offer some charity to the poor – the first instance of widespread, systematic welfare assistance by western governments.

While Tambora’s eruption produced disastrous impacts on regional weather, human health and society, mercifully its effects were relatively short-lived. After another, less extreme, cold summer in 1817, most of the stratospheric acid veil had dissipated. It would not be until the mid-1950s, while monitoring the Cold War nuclear tests, that scientists verified the effects of stratospheric particles on our climate – the “nuclear winter” scenario that resembles the effects of an eruption – and established what caused the extreme climate of the Year Without a Summer.

Nicholas Klingaman is the co-author of The Year Without Summer, recently published by St Martins Press

51MPyKdGfTL._SX330_BO1,204,203,200_.jpg


Floods, Famine, Frosts … and Frankenstein | Weather and Climate @ Reading
 
Last edited:

TxGal

Day by day
Wow, northern watch, just wow!! Huge amount of info you've posted overnight, and I'll be reading it most of the day, thank you!

We are in an areal flooding situation here, we're on high ground and safe, but have been getting heavy rain training for now the 2nd day. We needed the rain, but oh my...not so much at one time. And, we have a cold north wind. Just ick.
 

TxGal

Day by day
Record Daily Snowfall - Grand Isle, Michigan - Ice Age Now

Record Daily Snowfall – Grand Isle, Michigan
December 30, 2020 by Robert

In addition, Grand Isle shattered the 30- year averages for both December snowfall and yearly snowfall.

A year-end snowstorm blanketed Grand Island and central Nebraska yesterday.

It was a record snowfall for Grand Island on that date at 3.8 inches breaking the previous record of 3.5 inches set in 1936.

December has proven to be a snowy month.

With yesterday’s snowfall, Grand Island has received 12 inches during the month of December, almost triple the 30-year average is 4.8 inches of snow in December.

When it comes to snowfall for the entire year, Grand Island has had 13.5 inches of snow so far this year, handily surpassing the 30-year average yearly snowfall of 9 inches.

Hastings also had a record snowfall of 3.7 inches Tuesday. The previous record of 2 inches was set in both 1946 and 1973.

https://theindependent.com/news/local/record-snowfall-blankets-g-i-hastings/article_762766 12-4a62-11eb-a633-bf579da753b7.html
 

TxGal

Day by day
Dual storms to bring 4-5 feet of snow to Cascades by Sunday - Ice Age Now

Dual storms to bring 4-5 feet of snow to Cascades by Sunday
December 30, 2020 by Robert

Look for the first storm on Wednesday into Thursday morning.

Forecast models expect about 12-18 inches of new snow, with potentially even higher amounts up to 2 feet near Mount Baker. A Winter Storm Watch has been issued above 2,500 feet from late Tuesday night into Thursday morning.

Snow levels are expected to remain below all the passes, meaning heavy snow is likely along both Snoqualmie and Stevens Passes. Twelve to eighteen inches (30 to 45 cm) of new snow is forecast by Thursday morning with possible higher amounts at Mt. Baker & Paradise. #wawx

An even stronger stormy pattern is expected later Friday through the weekend as two more storms come in essentially back-to-back. For areas around Stevens Pass and higher, this has potential for a major snow event with 2-3 feet (60 to 90 cm) of new snow possible in the period. Travel along US-2 could be extremely difficult.

Dual storms to bring 4-5 feet of snow to Cascades by Sunday
 

TxGal

Day by day
The Oppenheimer Ranch Project has a new podcast out:

Small CME Headed Towards Earth - SOHO Data Scrubbed As Usual - YouTube

Small CME Headed Towards Earth - SOHO Data Scrubbed As Usual
4,090 views • Premiered 16 hours ago

View: https://youtu.be/1ar9RklKPrc
Run time is 4:18

Synopsis provided:

It appears that a small CME is headed toward Earth in a few days. The CME is predicted to impact on Jan, 3rd. The CME was produced potentially by a moderate B-flare. As usual the necessary data to diagnose the cause has been temporarily scrubbed from SOHO. That means us peons have to wait and see. https://go.nasa.gov/2R8QL1h ISWA

https://go.nasa.gov/2R8QL1h
171 Angstroms https://go.nasa.gov/3aPL5oe
304 Angstroms https://go.nasa.gov/37Yvlxa
Enlil Solar Wind Prediction http://bit.ly/3rIEYrV
GOES X-Ray Flux https://www.swpc.noaa.gov/products/go...
SOHO Theater https://soho.nascom.nasa.gov/data/The...
https://www.solarham.net/
 

TxGal

Day by day
Provisional World Record for High Air Pressure set in Mongolia as majority of Asia hit by Historic Cold - Electroverse

EqeUO43XEAEOeHv-crop-scaled-e1609415038106.jpg


PROVISIONAL WORLD RECORD FOR HIGH AIR PRESSURE SET IN MONGOLIA AS MAJORITY OF ASIA HIT BY HISTORIC COLD
DECEMBER 31, 2020 CAP ALLON

A new world record for high air pressure has provisionally been set in a high mountain valley in Mongolia.

An automatic weather station in Tsetsen-Uul, western Zavkhan province, recorded a mean sea-level pressure of 1,094.3 millibars along with bitter temperatures of -45.5C (50F).

If verified, it will top the previous world record of 1089.4 millibars also set in Mongolia exactly 16 years ago on Dec. 30.

Stephen Burt, a research fellow in meteorology at the University of Reading, told The Independent: “This looks as if it’s a genuine record, it’s from an official synoptic reporting station.

“There are other stations that are reporting very high pressures as well. So this isn’t just a reading error or a transmission error.

View: https://twitter.com/defis_eu/status/1344206698400116738

“It’s common at this time of year, right in the mid-winter, to get these very large extensive high pressure areas right over the continent,” continued Burt.

“Mongolia is a long way away from the sea, it’s got very little influence from the relatively warm ocean. The air gets very cold, the pressure gets very high and very sluggish, so it ends up sitting in an area.

“Because the high pressure tends to have little to no cloud in it, the air tends to get colder and colder because all the heat is escaping out into space. So, the pressure tends to get a bit higher every day and that goes on until spring, when the sun comes back and starts to warm the ground and the pressure begins to drop.”

And although such weather conditions are expected at this time of year, Mr Burt said “it’s not normal for it to get as cold as this or for the pressure to get as high”.

Temperatures have routinely dipped below -45C (-49F) across the Asian continent over the past few weeks, and in some cases below -50C (-58F).

View: https://twitter.com/olegsvn/status/1343308470662045696

For more:


Oh, and Burt was keen to add this little nugget–I assume to keep his AGW cabal funding in tact: If the new record is verified, it is important to note that it does not mean that the climate crisis isn’t affecting the region, he said.

Burt claimed the addition of new weather stations in remote parts of Mongolia are to blame, as new cold extremes are now more likely to be identified than they were before — but this is exactly the point skeptics make: if you spread the weather stations out, removing them from Urban Heat Islands, then you will achieve a much more accurate (and cooler) representation of the average global temperature.

Unfortunately though, logic doesn’t appear to be Burt’s strong suit, as he concludes: “Climate change certainly doesn’t mean that cold extremes are a thing of the past.”

No, Burt, it most certainly does not.

The COLD TIMES are returning, the mid-latitudes are REFREEZING in line with historically low solar activity, cloud-nucleating Cosmic Rays, and a meridional jet stream flow.

Both NOAA and NASA appear to agree, if you read between the lines, with NOAA saying we’re entering a ‘full-blown’ Grand Solar Minimum in the late-2020s, and NASA seeing this upcoming solar cycle (25) as “the weakest of the past 200 years”, with the agency correlating previous solar shutdowns to prolonged periods of global cooling here.

Furthermore, we can’t ignore the slew of new scientific papers stating the immense impact The Beaufort Gyre could have on the Gulf Stream, and therefore the climate overall.


Prepare accordinglylearn the facts, relocate if need be, and grow your own.
 

TxGal

Day by day
Britain Braces for its Biggest Snowstorm in a Decade+, as Rare Phenomenon Hits the Scottish Rivers of Dunbeath Strath - Electroverse

ice-pancakes.jpg


BRITAIN BRACES FOR ITS BIGGEST SNOWSTORM IN A DECADE+, AS RARE PHENOMENON HITS THE SCOTTISH RIVERS OF DUNBEATH STRATH
DECEMBER 31, 2020 CAP ALLON

Heavy snow and sheet ice is expected to cause carnage as the worst winter freeze in at least 10 years barrels down on Britain. A New Year weather warning has already been issued in Scotland, with the remainder of the home nations set for historic wintry blasts as January progresses.

Six inches of snow and sheet ice is expected to plague the northern UK this week as part of a cold snap which could see temperatures plummet to -20C (-4F) in some remote Highland regions, readings that will challenge many of the coldest daily temperatures ever recorded in the UK–so much for extreme lows and heavy snows being a thing of the past…

For reference, all of the UK’s daily lowest-ever recorded temperatures from Dec. 31 to Jan. 7 are above -21.2C (-6F), with the majority being above -20C (-4F): the UK is about to suffer a historic cold snap, one that will challenge the all-time records set during the disruptive freezes of 1941 and 1962.

Roads and pavements could be turned into deadly skating-rinks during a month-long mega-freeze, reports the dailyrecord.co.uk in typically dramatic fashion — but on this occasion, the hyperbole might just be justified.

And, as reported in the mirror.co.uk, the elderly and vulnerable are being urged to take care as the mercury plummets in what Jim Dale, meteorologist for British Weather Services, has called “the greatest threat posed by the weather at this time of year since the big freeze of 2010/11.

“We are expecting a north-easterly and easterly feed with air coming in from Russia and the surrounding regions,” continued Dale: “This will bring some very low temperatures and snow, and overall, this is looking like the most notable snow event for a decade.”

Such a development would disrupt rail and air services, and people are being warned of possible power cuts and road closures and delays.


GFS Total Snowfall (cm) for Dec. 31 – Jan 15 [tropicaltidbits.com].

Meteorologists are keeping a close eye on the Baltic region amid growing fears the killer Beast from the East in 2018 could rear its ugly head.

High pressure over Greenland will keep milder Atlantic conditions at bay while funneling Polar air in from Russia and the Baltic region.

“The beast is getting closer and at the moment it is stretching its claws across from the east towards Britain,” concluded Dale. “While the Atlantic weather is currently being held back by high pressure over Greenland, if this weakens it will allow more moist air into the UK where it will clash with cold air.

“This is looking like turning into a lengthy cold spell lasting at least into the middle of January.”

RARE PHENOMENON HITS THE RIVERS OF DUNBEATH STRATH
Plummeting temperatures around Dunbeath Strath have already whipped up the recipe for a very unique and strange phenomenon — ice pancakes.


Ice pancakes are a rare phenomenon that usually occur in very cold oceans and lakes. [Picture: Cath Whittles]

Ice pancakes require very specific conditions to form and are most commonly found in the Baltic Sea and Canada. In Scotland, these specific conditions are rare — however, in recent years sightings of ice pancakes have been on the rise with observations on the River Dee, around the Brora area and along River Helmsdale.

A Met Office spokesperson describes the phenomenon as a very “unique spectacle”.

As detailed above, temperatures will continue to fall over the coming days and weeks, meaning more pancakes may be in the offing.

The COLD TIMES are returning, the mid-latitudes are REFREEZING in line with historically low solar activity, cloud-nucleating Cosmic Rays, and a meridional jet stream flow.

Both NOAA and NASA appear to agree, if you read between the lines, with NOAA saying we’re entering a ‘full-blown’ Grand Solar Minimum in the late-2020s, and NASA seeing this upcoming solar cycle (25) as “the weakest of the past 200 years”, with the agency correlating previous solar shutdowns to prolonged periods of global cooling here.

Furthermore, we can’t ignore the slew of new scientific papers stating the immense impact The Beaufort Gyre could have on the Gulf Stream, and therefore the climate overall.


Prepare accordinglylearn the facts, relocate if need be, and grow your own.
 

TxGal

Day by day
Record Breaking Blizzard Blasts Nunavut, Canada - Electroverse

EqWH13oXEAIREG8-e1609408222119.jpg


RECORD BREAKING BLIZZARD BLASTS NUNAVUT, CANADA
DECEMBER 31, 2020 CAP ALLON

Pangnirtung mayor Eric Lawlor couldn’t see out his windows on Sunday, reports a number of Canadian publications. That’s when a record breaking blizzard hit the Baffin Island community, shaking houses and crushing cabins.

Environment and Climate Change Canada (ECCC) said Sunday’s storm brought record wind gusts and heavy snow to communities across Nunavut.

In Pangnirtung, winds officially reached 135 kmh (84 mph) that day, although local residents had registered top speeds in the 180’s kmh (110’s mph).

“It was like an all day thing. The wind was so strong,” Lawlor remarked.

Sky Panipak, who also lives in Pangnirtung, posted photos to Twitter of the damage caused by the storm, including a shack that had been floored:

View: https://twitter.com/HSS_Team/status/1343629438639079424

“Many shacks and cabins are gone. Many, many snowmobile windshields are gone. Some injuries we have heard of so far,” Panipak said, noting one resident had been medevaced to a southern hospital after being injured in the storm.

View: https://twitter.com/HSS_Team/status/1343933174527619072

Sara Hoffman, a meteorologist with ECCC, said the Dec. 27 storm affected most of the territory. Out of 25 communities, 23 were hit by the same storm, which came up from Quebec.

“It’s pretty unusual for a storm like that this late in December. We don’t typically see that,” Hoffman said, explaining that exceptionally cold weather from the northwest collided with warmer weather from the southeast to create the weekend blizzard.

View: https://twitter.com/HSS_Team/status/1343329159678976000

The COLD TIMES are returning, the mid-latitudes are REFREEZING in line with historically low solar activity, cloud-nucleating Cosmic Rays, and a meridional jet stream flow.

Both NOAA and NASA appear to agree, if you read between the lines, with NOAA saying we’re entering a ‘full-blown’ Grand Solar Minimum in the late-2020s, and NASA seeing this upcoming solar cycle (25) as “the weakest of the past 200 years”, with the agency correlating previous solar shutdowns to prolonged periods of global cooling here.

Furthermore, we can’t ignore the slew of new scientific papers stating the immense impact The Beaufort Gyre could have on the Gulf Stream, and therefore the climate overall.


Prepare accordinglylearn the facts, relocate if need be, and grow your own.
 

TxGal

Day by day
Beijing - Coldest December day in 42 years - Ice Age Now

Beijing – Coldest December day in 42 years
December 31, 2020 by Robert

Residents astonished at the sudden temperature drop.
__________

30 Dec 2020 – Apart from the resurgence of the coronavirus that has confined many Beijingers at home, local residents now have another reason to stay indoors – the bitter wind and extreme cold as the city saw its coldest recorded December day in 42 years at -26 C (-14.8F).

Residents were astonished at the sudden temperature drop.

“The forecast for Beijing is even colder than the North Pole,” a netizen on China’s Twitter-like Sina Weibo said early on Wednesday, posting screenshots of weather-tracking apps which read -13 C in Beijing and -3 C at the North Pole.

As a cold air mass swept across northern China and Beijing since Tuesday, temperatures plunged from an average daily high of 2 C to maximum highs of -6 C and lows of -13 C, some of the coldest December days in a decade.

Coldest December in Beijing casts shadow over epidemic control - Global Times
 

TxGal

Day by day
Antarctica Hit by unprecedented 50,000 earthquakes in 3 months - Ice Age Now

Antarctica Hit by unprecedented 50,000 earthquakes in 3 months
December 31, 2020 by Robert

“The area already is under scrutiny for its melting ice cap, and some have suggested buried volcanoes could be a reason.”
Spot on! I’ve been saying this for years.
____________

25 Dec 2020 – Scientists at the University of Chile’s Seismological Center say that Antarctica, normally a stable region of the world, has been hit by thousands of earthquakes in just the last three months, “more than a thousand earthquakes a day.”

The estimates range from 30,000 to 50,000, some measuring less than 1 on the Richter scale, others up to 6, reported Israel365 News.

“…an unprecedented 30,000-50,000 tremors shaking the Antarctic in the past three months, all concentrated in one spot.”
The spot is the Bransfield Strait, a 60-mile-wide body of water extending for some 300 miles.

The report explained that before the quakes, the strait was expanding by about one-third of an inch per year. Now it’s moving at six inches annually.

The area already is under scrutiny for its melting ice cap, and some have suggested buried volcanoes could be a reason.
If there are volcanoes, they also could explain the seismic activity and the huge chunks of ice falling off of ice floes into the ocean.

“It is also possible that the shaking is being caused by methane vents opening up. Earlier this year, a team of researchers with Oregon State University has confirmed the first active leak of sea-bed methane discovered at McMurdo Sound situated in the Ross Sea. Scientists believe that there is a large amount of methane sealed beneath the ocean floor off the coast of Antarctica,” the report said.

Do you suppose this increase in activity has anything to do with the recent conjunction of Jupiter and Saturn? How about the Grand Solar Minimum?

See entire article by Bob Unruh:


TxGal

Day by day
The Oppenheimer Ranch Project has a new podcast out:

2021= Snow & Ice For Tens Of Millions - Happy New Year! - St. Vincent Eruption? - Food Shortages? - YouTube

2021= Snow & Ice For Tens Of Millions - Happy New Year! - St. Vincent Eruption? - Food Shortages?

2,742 views • Premiered 7 hours ago

View: https://youtu.be/y71FTtEibsA

Run time is 21:51

Synopsis provided:

2021 to get off to icy start for tens of millions in northeastern US https://bit.ly/33RzeRc
-50 degrees recorded at Antero Reservoir in Colorado http://bit.ly/34V72yr
Snow Falls in West Texas; Travel Advisory - 18 Inches of Accumulation http://bit.ly/2WXqbLG
Power Outages US LIVE https://poweroutage.us/
New Year to usher in accumulating snow, troublesome ice http://bit.ly/2MkRPjD
Cities issue snow emergencies for New Year’s Day storm http://bit.ly/3hwdiSa
‘Bomb cyclone’ builds in Aleutian Islands http://bit.ly/3n3G265
SNOWFALL ANALYSIS FROM THE LAST 48 HOURS http://bit.ly/37ZQHZh
GFS Model Total Snowfall USA http://bit.ly/3509Xpq
Multiple Significant Weather Hazards into the New Year https://www.weather.gov/
GFS Model Total Snow Europe http://bit.ly/332e83w
BRITAIN BRACES FOR ITS BIGGEST SNOWSTORM IN A DECADE+ http://bit.ly/3hCavqD
RECORD BREAKING BLIZZARD BLASTS NUNAVUT, CANADA http://bit.ly/352hW5r
BEIJING RECORDS COLDEST DECEMBER DAY IN 42 YEARS http://bit.ly/2X1BsL2
PROVISIONAL WORLD RECORD FOR HIGH AIR PRESSURE SET IN MONGOLIA AS MAJORITY OF ASIA HIT BY HISTORIC COLD http://bit.ly/2MoJ7Rz
St. Vincent issues warnings after La Soufriere volcano spews ash http://bit.ly/3n4tTO7
ISWA SPIRAL https://go.nasa.gov/2R8QL1h
and more...
 

TxGal

Day by day
Strongest Low in the World to Deliver Unprecedented Snow to Western Canada and Northwest U.S. - Electroverse

low-pressure-Alaska.jpg


STRONGEST LOW IN THE WORLD TO DELIVER UNPRECEDENTED SNOW TO WESTERN CANADA AND NORTHWEST U.S.
JANUARY 1, 2021 CAP ALLON

On Wednesday, December 30 a monster storm intensified across the western Pacific, one that brought record-breaking cold and snow to Japan.

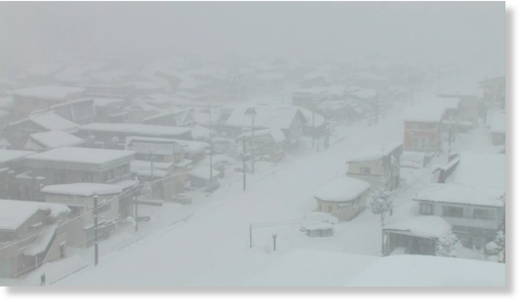
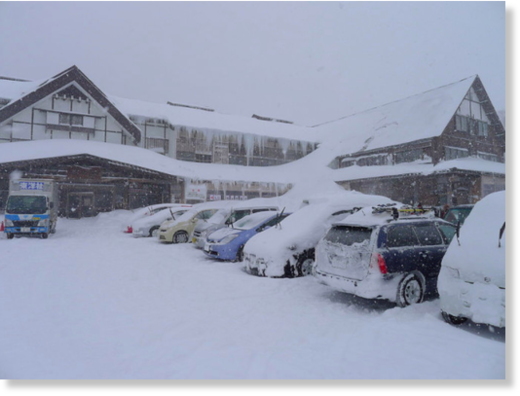
The system set many new monthly low temperature records across Japan, including in the nation’s northern town of Horokanai where a staggering -32.6C (27F) was logged (shown below). Some eastern and northern regions are also forecast to pickup 4+ meters (13+ feet) of snow during the first week of January.

View: https://twitter.com/extremetemps/status/1344418864139005955

The interaction of this frigid Arctic air mass with a powerful Pacific jet stream then resulted in a rapid intensification, reports ca.news.yahoo.com.

As the Siberian air flowing across the western Pacific met warmer, sub-tropical flow south of Japan, it created the necessary conditions to push the atmosphere to the limit.

The Pacific’s explosively intensifying low ranks as the strongest nontropical cyclone since at least 1958.

According to the washingtonpost.com, the storm’s pressure dropped to 921 millibars on New Year’s Eve, meaning it also qualified as the strongest storm on record to hit Alaska.

View: https://twitter.com/TheSteveCop/status/1344699399096696834

Climatologist Brian Brettschneider on Twitter was there for the record breaking moment when at around midday on Dec. 31 Alaska’s previous record low pressure of 925 millibars –set in 1977 (solar minimum of cycle 20)– was eclipsed by a new reading of 924.8 millibars:

View: https://twitter.com/Climatologist49/status/1344769328206364672

The record breaking system is transporting the coldest airmass on the planet from Siberia across the Pacific Ocean. And while currently centered over the uninhabited Aleutian Archipelago in Western Alaska, all of that energy traversing the Pacific Ocean will soon create wintry weather chaos in western Canada and the NW U.S., and as reported by ca.news.yahoo.com, B.C. ski resorts will be measuring snowfall, not in centimetres, but in metres in the days and weeks to come.


GFS Total Snowfall (inches) Jan 1 – Jan 16 [tropicaltidbits.com].

The storm also presents an amazing contrast from a provisional world record high-pressure zone currently sitting over Mongolia:

Provisional World Record for High Air Pressure set in Mongolia as majority of Asia hit by Historic Cold

For more:


The COLD TIMES are returning, the mid-latitudes are REFREEZING in line with historically low solar activity, cloud-nucleating Cosmic Rays, and a meridional jet stream flow.

Both NOAA and NASA appear to agree, if you read between the lines, with NOAA saying we’re entering a ‘full-blown’ Grand Solar Minimum in the late-2020s, and NASA seeing this upcoming solar cycle (25) as “the weakest of the past 200 years”, with the agency correlating previous solar shutdowns to prolonged periods of global cooling here.

Furthermore, we can’t ignore the slew of new scientific papers stating the immense impact The Beaufort Gyre could have on the Gulf Stream, and therefore the climate overall.


Prepare accordinglylearn the facts, relocate if need be, and grow your own.
 

TxGal

Day by day
Heavy snow continues in mountainous areas of Japan - up to 2 meters -- Earth Changes -- Sott.net

Heavy snow continues in mountainous areas of Japan - up to 2 meters

NHK WORLD-JAPAN
Fri, 01 Jan 2021 13:20 UTC

snow

Snow caused by a powerful frigid air mass is intensifying mainly in mountainous areas along the Sea of Japan coast on New Year's Day.

The Meteorological Agency says heavy snow is falling along the Japan Sea side of the Hokuriku and Tohoku regions.

Snow has accumulated in mountainous areas and on lower ground. At 6 a.m. on Friday, there were two meters of snow in Okura Village in Yamagata Prefecture, and 141 centimeters in Uonuma City in Niigata Prefecture.


The snow is expected to continue through Sunday. More snow will likely accumulate on the plains as well.

View: https://youtu.be/dskxHfhJFcI
Run time is 1:18

View: https://youtu.be/VWhekYTY6lA
Run time is 10:34

View: https://youtu.be/OZRU9-gWsJs
Run time is 1:35

The Meteorological Agency is advising people to watch out for snow sliding off roofs, for avalanches, and for blackouts caused by snow on trees and overhead cables.

People clearing snow from roofs are advised to ask another person to come along, and to take safety precautions when under the eaves.

More than 80 domestic flights have been canceled for Friday and Saturday. Train services have also been disrupted. Airline and railway companies are calling on passengers to check their websites for the latest information.
 

TxGal

Day by day
Parts of Japan see record low temperatures down to -32C° (-25.6F°) -- Earth Changes -- Sott.net

Parts of Japan see record low temperatures down to -32C° (-25.6F°)

Kevin MacKay
The Weather Network
Thu, 31 Dec 2020 13:37 UTC

The outside of Sukayu Onsen in late December 2012.
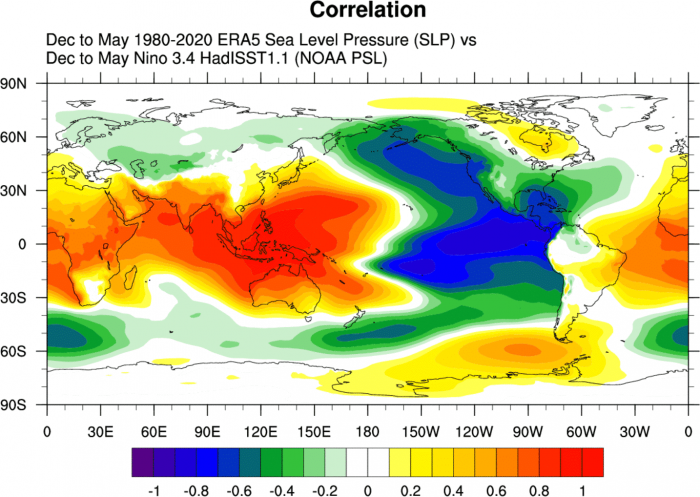
© Nogiuchi via Wikimedia Commons
The outside of Sukayu Onsen in late December 2012.

Japan is home to the snowiest inhabited place on Earth and has many world-renowned ski resorts.

A record breaking low pressure system, now centred over the Aleutian Archipelago in Western Alaska, is transporting the coldest airmass on the planet from Siberia and over the Pacific Ocean. This system triggered record low temperatures in many locations across northern Japan during the last week of 2020, with Horokanai bottoming out at a bone-chilling -32.6°C and many nearby regions seeing temperatures around -30°C.

This system also brought enormous amounts of snow to Japan that has many winter sport fans around the world impressed.

Canada is no stranger to heavy snow, usually coming in the form of lake-effect, sea-effect or alpine snow. Japan, however, can put Canada to shame in this category. When all the ingredients come together, Japan can produce some of the highest snowfall rates on Earth.

In fact, Sukayu Onsen, located in the city of Aomori, is the snowiest inhabited place on Earth and has an average yearly snowfall of 17.6 m.

This part of the world sees such significant amounts of snowfall because Siberian air rushes over the Sea of Japan and abruptly runs into the Japanese Alps, which contain 22 peaks over 3,000 m. The combination of the mountainous geography and atmospheric conditions recently resulted in over 200 cm of snow accumulating in Minakami during a 72 hour period, with seasonal totals surpassing 3,000 cm.

Although 2021 isn't expected to start off by breaking those records, parts of northern and central Japan could receive 300-400 cm of snow through the first week of 2021.

Many ski resorts in Japan are considered to be some of the best destinations on the planet because of the snow's quality and staggering accumulations. For example, Hakuba hosted the 1998 Nagano Winter Olympics and has an annual snowfall rate of 10-11 m. Due to the alpine location, Habuka's snow season ranges from November to May since temperatures range from -7°C to -2°C near sea level and -7°C to -14°C at the highest elevations.

The system that was responsible for the heavy snow and bitter cold in Japan will deteriorate over the coming days, but a new low pressure system will form in the Sea of Japan midweek and will look to replace the current low as the king of the Bering Sea. Coupled with the usual strong ridge over Western Siberia, this active pattern shows no sign of stopping through mid-January.

Comment:
View videos here: Heavy snow continues in mountainous areas of Japan - up to 2 meters
 
Top