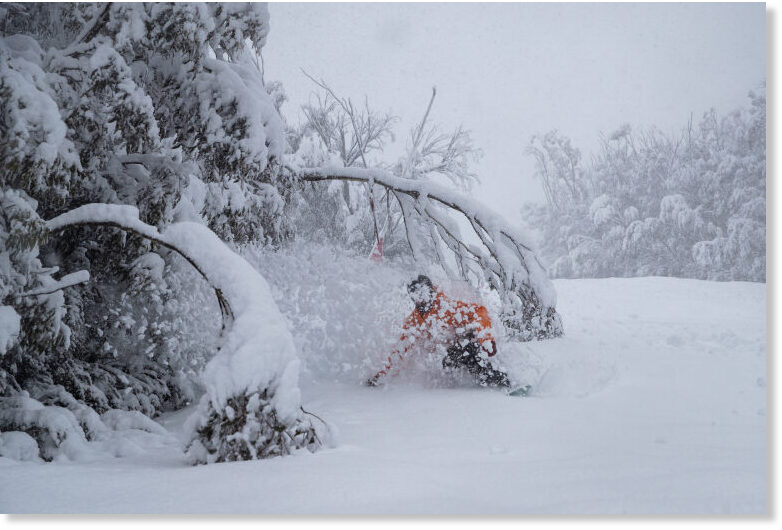
Solar Grand Solar Minimum part deux

TxGal

Day by day
Thanks, Martinhouse! As Martinhouse said, Adapt 2030 has a new podcast out:

View: https://www.youtube.com/watch?v=afDPrtByQH8


Comets and Lost Crops as China Buys 2nd Largest Amount in 25 Years (1012)
3,622 views•Jul 13, 2020
Run time is 7:01

China continues to be hit with 100 year floods and with flood gates wide open all along the Yangtze River, the only option to prevent over topping dams is to push water into vast swaths of farmland countryside. This is a reason in addition to the HK Dollar un-peg that the central government has bought the 2nd largest quantity of corn on record in a single purchase. China also unveiling 5G hydrogen driverless farm equipment line. Comet NeoWise in the skies.
 

TxGal

Day by day

Rescue of horses from the snow – Video
July 13, 2020 by Robert

Argentina, July 12, 2020 – Video: the rescue of horses caught in the snow in Neuquén.
Félix Castillo was one of the protagonists of a heroic feat: they rescued several horses that had been trapped in the snow in the middle of the mountain range in Neuquén. Félix recorded the adventure and the images quickly went viral through social networks.

View: https://youtu.be/5IH9ioUgmqQ


In the images that the young man shared, around nine equines can be seen buried and with great difficulty moving.
“This is how we rescued our gang yesterday,” wrote Felix, on his Facebook, who he said, even though the sky was clear, the wind played against them and froze their clothes, so the rescue was very complicated.

“It was not easy at all, but we managed to get home at 11 pm with a night in which ice, snow and wind fell, but with our troupe”, completed Felix about the exciting rescue and thanked his uncle, his nephew and a friend for having managed to save all the animals.

In addition, he was happy to show the images so that people “who have not seen the effort” that the crianza farmers from the north of Neuquén make when it snows, know their value. “Thanks to all who share, so that all see the sacrifice and the wonders of the field,” wrote Felix.

Now can you image being trapped by nine stories of snow in one day? That’s how the mammoths were trapped with flowers still in their mouths.

Video: el rescate de unos caballos atrapados en la nieve en Neuquén | Filo News
 

TxGal

Day by day

Ecy59KTWkAEAyZV-e1594638620901.jpg


RECORD SUMMER COLD SWEEPS THE NETHERLANDS
JULY 13, 2020 CAP ALLON

According to weerplaza.nl, 5 weather stations across northern Holland have just busted all-time low temperature records for the month of July.

Since record books began, the daily-high has never been lower in the regions of Leeuwarden, Nieuw-Beerta, Lauwersoog, Hoorn, and Vlieland.

A max of just 13.7C was registered in Vlieland, smashing the village’s old record of 16.2C set in 2000.

Lauwersoog set a new record low-max of 14.9C.

Nieuw-Beerta shivered through 14.7C.

Hoorn saw 16.2C.

And Leeuwarden’s 14.1C beat-out 1978’s record of 14.3C.


One that narrowly missed out: Eelde’s reading of 14.2C on July 9 came close to busting its all-time low-max of 14.0C — set back in 1909. That reading did however beat-out the next two coldest days: 2000’s 14.8C and 1978’s 15.1C.
Since Friday, the anomalous summer cold has persisted across Holland:

View: https://twitter.com/KrijnGiessen/status/1282604609283010561


And the chill is actually intensifying across the majority of Europe, too.

Here, temperature departures up and down the continent look set to tumble some 4C-12C below the seasonal average as July progresses:


GFS 2m Temp Anomalies — July 14 [tropicaltidbits.com]

Don’t fall for bogus political agendas.

The COLD TIMES appear to be returning in line with historically low solar activity, cloud-nucleating Cosmic Rays, and a meridional jet stream flow.

Even NASA appear to agree, if you read between the lines, with their forecast for this upcoming solar cycle (25) seeing it as “the weakest of the past 200 years,” with the agency correlating previous solar shutdowns to prolonged periods of global cooling here.


Prepare accordinglylearn the facts, relocate if need be, and grow your own.
 

TxGal

Day by day
The Oppenheimer Ranch Project has a new podcast out:

View: https://www.youtube.com/watch?v=zuBhnNP_xJM


Death Valley Recorded the Hottest Temperature on Earth This Year, Repeating The 106 Year Solar Cycle
3,102 views•Premiered 7 hours ago

Run time is 7:06

Death Valley Recorded the Hottest Temperature on Earth This Year https://bit.ly/2WxOAI7
Death Valley sets record for planet's hottest temperature in years https://cbsn.ws/38S8Ngo
Two of the world's 4 all-time hottest temperatures have occurred in the past 3 years https://bit.ly/2Zr9M4k
Highest recorded temperature https://bit.ly/3j2sabd
Sunspots https://bit.ly/301PNYY Central England Temps vs Sunspots https://bit.ly/3gZyU8i
 

TxGal

Day by day

MM-ice-1-e1594717598850.jpg


GRAND SOLAR MINIMUM AND THE SWING BETWEEN EXTREMES
JULY 14, 2020 CAP ALLON

Research shows “blocking” persistence increases when solar activity is low, causing weather patterns to become locked in place at high and intermediate latitudes for prolonged periods of time.

During a Solar Minimum, the jet stream’s usual Zonal Flow (a west–east direction) reverts to more of a Meridional Flow (a north-south direction).

This is exaggerated further during a Grand Solar Minimum (GSM), like the one we’re entering now, and explains why regions become unseasonably hot or cold and others unusually dry or rainy, with the extremes lasting for an extended period of time.

Changing-Jet-Streams-e1591953164738.jpg

Zonal flow (left) vs Meridional flow (right) — more HERE.

Mikhaël Schwander, et al, 2017 — “The zonal flow characteristic of westerly types is reduced under low solar activity as the continental flow for easterly and northerly types is enhanced. This is also confirmed by the higher blocking frequency over Scandinavia under low solar activity.”

And the Schwander paper, entitled “Influence of solar variability on the occurrence of central European weather types from 1763 to 2009”, goes further:

“The 247-year-long analysis of the 11-year solar cycle impact on late winter European weather patterns suggests a reduction in the occurrence of westerly flow types linked to a reduced mean zonal flow under low solar activity. Based on this observational evidence, we estimate the probability to have cold conditions in winter over Europe to be higher under low solar activity than under high activity.”

The Sun appears to be slipping into its next Grand Solar Minimum cycle–a multidecadal spell of reduced solar output where the solar disc can be devoid of sunspots for months or even years at a time.

The result on Earth’s climate will be one of violent swings between extremes. Intense bursts of heat will linger in one area, while a teeth-chattering chill will dominate nearby — and then the regions will “switch”. It’s this unpredictable chopping and changing that will hasten the failure of our modern food production systems — crops will fail, on a large scale, and famine will quickly ensue.

Great-Frost.jpg
MM-ice.jpg


Overall, Earth’s temperature trends colder during a GSM as the Sun’s output sinks lower and lower (increasing cloud nucleation, for one). However, not ALL regions experience the chill. As with the previous GSM (the Maunder Minimum 1645-1715), areas like the Arctic, Alaska, and S. Greenland/N. Atlantic actually warm during bouts of otherwise “global” cooling — NASA reveals the phenomenon in their Maunder Minimum temperature reconstruction map:


Temp change between 1780 (a year of normal solar activity) and 1680 (a year within the depths of the Maunder Minimum) — NASA.

History is repeating.

Earth’s climate is cyclic, never linear.

The Arctic appears to be warming again -slightly- but in line with the historically low solar activity we’re currently experiencing and it’s effect on the jet stream, and not due to Man’s irrelevant CO2-excretions.

Furthermore, if you remove the Arctic’s, Alaska’s and S. Greenland’s/N. Atlantic’s temperature readings from the UAH global lower atmosphere data set, you’re left with a dramatically cooler planet.

The COLD TIMES are returning folks, the lower-latitudes are REFREEZING, in line with historically low solar activity, cloud-nucleating Cosmic Rays, and a meridional jet stream flow.

Even NASA appear to agree, if you read between the lines, with their forecast for this upcoming solar cycle (25) seeing it as “the weakest of the past 200 years,” with the agency correlating previous solar shutdowns to prolonged periods of global cooling here.


Prepare accordinglylearn the facts, relocate if need be, and grow your own.

Winter 2020-2021 is going to be brutal.
 

Martinhouse

Deceased
On his Twitter page, David BuByne has posted a picture of some beautiful backyard gardens in what I assume is suburban or semi-suburban Havana.

Comment above picture is: Cuba-geddon? Amid COVID Crisis. Havana Tells Citizens to "Grow Your Own Food" or Starve.
 

Martinhouse

Deceased
Thanks for posting the picture, TxGal!

Aren't those some pretty gardens? I wonder if those are private houses or the backyards area of a long line of townhouse type apartments? I think I'm seeing two colors of roof, but not sure.

I'll bet there's more garden behind that hedge I see at the "back" of the picture!

Those barrels could be for water or a place to toss weeds so they can compost.
-----
Hmmm. The more I look at that "hedge", the more it looks like it might be a framework with vines on it! My eyes get pretty sticky by this time of day, so I can't tell for sure. If so, then there's more garden for sure on the other side of it.
 
Last edited:

Sammy55

Veteran Member
We're in northeastern Minnesota and we've had hot, dry weather for the last month or so. But for the last few days, and especially today, the weather has been downright cold! Hard to go from 90 degree days down to mid 60s. The last few nights have been in the low 50s. Brrrr!! I'm not complaining as I can handle the colder days better than the 90 plus days! But even my husband agrees with me that some of these days feel more like fall than summer!! He said that the last few weeks that the hot days had cold winds coming out of the northwest, which is the where the cold winter winds come from. He said that those days, even though the temps were high, the winds made it feel like fall instead of summer.

We are working hard on getting prepared for a bad and cold winter. We have our garden in but it went in late due to late frost almost to the middle of June! Those were unreal days with very nice very warm daytime temps but below freezing at night! And now with the really dry weather, the garden is not doing the best. Plants are sluggish as it was so hot for so many weeks and not enough water. I water, but I don't want to run the well dry.

I plan to start hitting the farmers markets and buying produce that I think our garden won't be able to provide. And then I'll start canning, drying, and freezing.
 

Sammy55

Veteran Member
Thanks, Martinhouse and TxGal, for all of your work on keeping this thread up to date. I check in every day or so to catch up and see what's happening. I don't have time to go to all of the podcasts, but I appreciate the summaries, articles, and your comments (as well as others' comments). Thanks much!
 

TxGal

Day by day
As Martinhouse said above, Adapt 2030 has a new podcast out:

View: https://www.youtube.com/watch?v=bzKzdFrcfSA


How Expensive Will it Get in 2021 (Bob Kudla 1/2)
7,262 views•Jul 14, 2020

Run time is 20:33

Bob Kudla from Trade Genius and David DuByne of ADAPT 2030 discuss how the record floods in China with a de-pegging of the HK Dollar from the US Dollar will ripple through the global economy causing incredible inflation for food and daily essentials. With that said there ar many places that will weather the financial storm which Bob discusses as well.

• China Floods
• De-pegging of USD from HKD
• ChainLink Cryptocurrency
• U.S Dollar Shortage for trade settlements
• US Dollar strengthens
• Global Debt Jubilee
• XRP and ChainLink Centralized Cryptocurrency
• Decentralized Cryptocurrency
 

TxGal

Day by day
The Oppenheimer Ranch Project has a new podcast out"

View: https://www.youtube.com/watch?v=PtutEYjhkJk


RISKS FOR LIFE ON HABITABLE PLANETS FROM SUPER-FLARES OF THEIR HOST STARS, IMPLICATIONS & THE FUTURE
2,475 views•Premiered 10 hours ago

Run time is 8:43

RISKS FOR LIFE ON HABITABLE PLANETS FROM THEIR OWN STARS http://bit.ly/36dedQn
Huge ‘Lion’s Roar’ Superflare Seen From Japan Should Be A Wake-Up Call For Earthlings https://bit.ly/2WcKwwv
New Japanese Telescope Detects Immense “Superflare” on Nearby Star https://bit.ly/3iOk4mJ
KYOTO UNIVERSITY SCIENTISTS OBSERVE HUGE ‘SUPERFLARE’ FROM RED DWARF STAR 16 LIGHT YEARS AWAY https://bit.ly/3gPeoqD
Optical and X-ray observations of stellar flares on an active M dwarf AD Leonis with the Seimei Telescope, SCAT, NICER, and OISTER https://bit.ly/3gNHQxg
 

TxGal

Day by day

Iceland Earthquake Swarm Continues – Hits Over 10,000 Quakes
July 14, 2020 by Robert

Scientists speculate that it could relate to geothermal production in the area.
________________

It’s the biggest swarm to hit the Tjörnes Fracture zone in almost half a century, and experts are unsure what is causing it – or when it will end.

“It is very difficult to say [when the swarm will end],” said Kristín Jónsdóttir, Earthquakes Hazards Officer for the Icelandic Meteorological Office (IMO). “The behavior is episodic, we record hundreds of earthquakes in a few hours and then it becomes quiet and all of a sudden it starts again. The last swarm in 2012 was ongoing for a few weeks. Let’s hope we only have a few weeks to go.”

Jónsdóttir had previously told Icelandic National Broadcasting Service RÚV that the cause of the current earthquake swarm was not known, but that they were “trying to figure out what’s going on.” She said it could relate to geothermal production in the area.

I posted about this back on June 30, when the earthquake count stood at about 9,000.

https://www.newsweek.com/iceland-earthquake-swarm-10000-1515899
 

TxGal

Day by day

blast_crops.jpg


NOAA RELEASES NEW INTERACTIVE SOLAR CYCLE TOOL — BIG FREEZE (VOLCANIC ERUPTION) BY THE YEAR 2027?
JULY 15, 2020 CAP ALLON

[Featured Image: the effects of Mt. Tambora’s 1815 eruption were felt across North America — vital corn crops withered from killing frosts smithsonianmag.com].

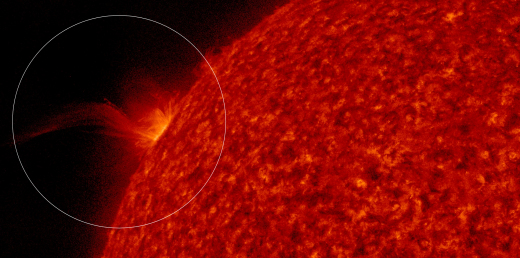
The Sun appears to be shutting down (relatively), and evidence continues to mount suggesting the onset of Earth’s next solar-driven BIG FREEZE is here — SUNSPOT COUNT is a great barometer for this.

Solar Minimum is a natural part of the ~11 solar cycle. The cycle goes: Solar Maximum — Solar Minimum — Repeat. During Solar Minimum, the sun is usually blank–that is, without sunspots. During Solar Maximum, the sun is peppered with dark spots.


Solar Max vs Solar Min

The cycle was noticed in 1843 by Samuel Heinrich Schwabe, though we have reliable sunspot observations running all the way back to 1610. Just recently, NOAA released an interactive tool cataloging sunspots from 1750. The tool allows you to scroll back through time, comparing sunspot counts now to peaks and valleys of the past — “one thing is clear,” writes Dr Tony Phillips on spaceweather.com, “Solar Minimum is here, and it’s one of the deepest in a century.”

In 2019, the Sun registered 281 spotless days (a new space age record), and 2020 is (so far) producing spotless days at about the same rate.

NASA has correlated previous periods of low solar activity to global cooling (here). But making the correlation yourself is easy thanks to NOAA’s new tool:

ises-solar-cycle-sunspot.png

www.swpc.noaa.gov

Unfortunately though, comparing the previous Grand Solar Minimum (the Maunder Minimum 1645-1715) can’t be done using the tool. However, both the Dalton Minimum and the Centennial Minimum can be compared.

The Dalton Minimum (1797-1833) brought with it a period of lower-than-average global temperatures. The Oberlach Station in Germany, for example, experienced a 2C decline over 20 years which devastated the country’s food production.


The Dalton Minimum (1797-1833).

The Year Without a Summer also occurred during the Dalton Minimum, in 1816 — it was the result of steadily cooling temps plus the powerful volcanic eruption of Mt Tambora in 1815 (low solar activity has been linked to a volcanic uptick, see here & here). Crop failure tore through Eurasia and the Americas during 1816, which led to food riots, famine, and ultimately the deaths of millions upon millions of people.

Note the time-frame here — the cold didn’t really take hold until AFTER the first weak Solar Cycle (5) had run its course (i.e., there was a lag). The big freeze hit AFTER the next Solar Cycle (6) had already begun–a good 19 years from the start of the Dalton (also note the longer minimums during Cycle’s 5 & 6).
Let’s play that same time-frame out today — 19 years after the onset of Solar Cycle 24 takes us to 2027 — could our big freeze commence around this year?


Solar Cycle 24 and NOAA’s forecast for Cycle 25.

NOAA’s forecast sees 2027 on the slide back down towards the Minimum of Solar Cycle 25. However, they assume SC25 will begin in 2020–an eventually by no means set in concrete. Because although Solar Cycle 25 is undoubtedly showing signs of life, the signs -to date- have been small, the Solar Minimum of Cycle 24 is still firmly in charge, and it’s really anyone’s guess how long it will persist…

Looking at the past year of daily solar wind at SOHO, you can clearly see the speed has been decreasing, and that we’re still actually extending lower:


The Electron Flux (below) further supports this — we are holding at or near the bottom, which also indicates we’re still in the minimum of solar cycle 24:


And likewise, the good-old solar cycle sunspot number progression (through May, 2020) also reveals us firmly rooted within the deepest solar minimum of the past 150 years:


Solar Cycle 25 is on the way, but it isn’t certainly here yet — and with each additional day this deep SM of Cycle 24 drags out, the more we’re going to suffer down the line–the COLDER it’s going to get.

The COLD TIMES are returning, the lower latitudes are REFREEZING, in line with historically low solar activity, cloud-nucleating Cosmic Rays, and a meridional jet stream flow.

NASA, like NOAA, think SC25 will be a weak one — but NASA sees it even lower than NOAA, and have suggested it will be “the weakest of the past 200 years”:


GSM-and-Sunspots.png


Prepare accordinglylearn the facts, relocate if need be, and grow your own.
 

TxGal

Day by day

Big snow totals across the Snowy Mountains, Australia - nearly 40 inches in 24 hours

Reggae Elliss
Mountain Watch
Tue, 14 Jul 2020 19:46 UTC

The freshies in Thredbo were best yesterday morning, the snow getting heavier as the day went on.
© Thredbo

The freshies in Thredbo were best yesterday morning, the snow getting heavier as the day went on.

Well, that was an incredible 24 hours for the NSW resorts with 70-100cms of snow in a 24-hour period, the higher totals falling above 1800 metres, but there was also snow all the way down to Jindabyne and beyond.

The first snow fall came through on Sunday with a few centimetres during the day before things kicked in overnight, leaving 17cms on the deck outside my place in Thredbo Village and 40+cms on the mountain by yesterday morning.

The snow kept falling all day, dumping at times, before it finally eased at around 8pm last night and there's a few lingering snow showers today. The result is 100% of the terrain in the NSW resorts now has a good base and more lifts will open this week.

View: https://youtu.be/yF67j-CaXPw


View: https://youtu.be/fvWrAc4aJCw


In the lead up to the snowfall the forecast models had the snow totals jumping around each day, with a mix of rain and snow on the weekend and the snowline expected around 1650 metres. On Thursday July 9, the Mountainwatch models were calling 50cms for 1830m across the Snowy Mountains, but the following day they had dropped back to 20-25cms.

The models changed for the better the next day, the Grasshopper writing in his latest season update on Saturday that a low-pressure system that would park itself off the NSW coast and direct a moist southeast flow over the Australian alps, but temps would be marginal:

"NSW resorts are in the firing line where 15-20cm should fall on lower slopes during the first half of the day before snowlines lift to about 1800. The second half of the day will see snow continuing on upper slopes, where 40-60cm is expected in total for the day, while snow turns to rain lower down. Resorts in Victoria will see much less snow fall on upper slopes, and just rain lower down."

The first big snowfall since the start of May and it was a good one. Perisher yesterday morning.
© Perisher
The first big snowfall since the start of May and it was a good one. Perisher yesterday morning.
 

TxGal

Day by day

Incredible rare peek at Patagonia in winter, high pressure area bringing unusually cold temperatures

Kathryn Hansen
Scitechdaily.com
Mon, 13 Jul 2020 19:22 UTC

June 26, 2020
Patagonia, June 26, 2020.

In southern South America, clouds often rule the skies. But in June 2020, just the right weather patterns were in place to provide a rare, clear view of Patagonia in winter.

On June 26, when the Moderate Resolution Imaging Spectroradiometer (MODIS) on NASA's Aqua satellite acquired these images, skies were clear over nearly all of Patagonia, which spans more than 1 million square kilometers of the continent's southern end. Snow cover is visible from the western slopes of the Andes Mountains in Chile to the coastal lowlands in Argentina.

According to René Darío Garreaud, a professor at the University of Chile, it's unusual to see such a widespread cloud-free area over Patagonia. "The last time that I saw a completely clear image was in February 2019," he said. At that time, during the Southern Hemisphere's summer, the warm seasonal temperatures meant snow and ice were mostly limited to the spine of the Andes and the Patagonian icefields.

The region is typically cloudy in satellite imagery due to the year-round passage of storms. The southern tip of the continent dips into a belt of prevailing westerly winds, along which high- and low-pressure systems constantly drift eastward. The terrain also enhances the region's cloudiness: when winds encounter the Andes, moist air blowing in from the Pacific Ocean is forced upward, where it cools and condenses into clouds.

In June, the usual weather pattern came to a halt. A system of high pressure settled in over the Drake Passage—the waterway just south of the continent—and brought clear skies to the wider region. The weather system stayed put for nearly a week. The phenomenon is known as a "blocking high," aptly named because it blocks the typical movement of air masses. In this case, westerly winds were forced to take a detour.

As a result of the blocking high, unusually cold temperatures stretched from Patagonia all the way to Paraguay and Bolivia. Cloud-free skies mean that heat near the land surface can more easily escape to space, resulting in cooler temperatures. In addition, the diverted westerly winds brought cold air from Antarctica and funneled it right into southern Patagonia.

June 26, 2020
June 26, 2020

Those cold temperatures kept the Patagonian plateau in Argentina blanketed under snow that fell during a major storm on June 23-24. Parts of the southern Andes receive abundant precipitation each year, measuring more than 500 centimeters (200 inches). It's less common, however, to see snowfall so far east on an arid part of the continent that receives less than 30 centimeters (12 inches) of precipitation each year.

The bout of frigid air, however, was not enough to freeze the deep lakes east of the icefield (detailed image). "Even in winter, surface air temperatures are generally above 0 degrees C.," Garreaud said. "So the cold event was intense, but not long enough to freeze these lakes." Left unfrozen, the lakes' turquoise color—a result of "glacial flour*"—contrasts even more with the surrounding white snow.

* Glacial flour is a fine powder of silt- and clay-sized particles that a glacier creates as its rock-laden ice scrapes over bedrock; usually flushed out in meltwater streams and causes water to look powdery gray; lakes and oceans that fill with glacier flour may develop a banded appearance; also called rock flour.

NASA Earth Observatory images by Lauren Dauphin, using MODIS data from NASA EOSDIS/LANCE and GIBS/Worldview.
 

TxGal

Day by day
Thanks, Martinhouse and TxGal, for all of your work on keeping this thread up to date. I check in every day or so to catch up and see what's happening. I don't have time to go to all of the podcasts, but I appreciate the summaries, articles, and your comments (as well as others' comments). Thanks much!

You're welcome! It truly is very much a group effort, with each and every post that people make adding to the big picture - especially about what they're experiencing locally and how they're responding. With so much going on, I don't think anyone can keep up fully every day....sooner or later I get back to watch the podcasts in full. Seems like a lot is coming out now.
 

nomifyle

TB Fanatic
We are in a dry spell here in my neck of the woods, good thing DH collects rain water to water the animals and the gardens. Its kind of expensive to use the tap.

Judy
 

TxGal

Day by day
We are in a dry spell here in my neck of the woods, good thing DH collects rain water to water the animals and the gardens. Its kind of expensive to use the tap.

Judy

Us, too. I'm really hoping for a burn ban. This dry scares the heck out of me.
 

TxGal

Day by day

Record cold in Southern Brazil
July 15, 2020 by Robert

South Brazil -10°C frost

Minus 10 °C!! Not so cold at this time of year since 1991 / August SC didn’t register a minimum temperature of negative two digits since 8/2/91

It is the lowest temperature ever registered at this time of year in the SC high mountains.

From CLIMATERRA (Ronaldo Coutinho e Piter Scheuer)

PREVISÃO E MONITORAMENTO CLIMATICO. (Climate Forecast and Monitoring)

Please let me know if I translated this (generally) correctly.

View: https://twitter.com/Climaterra/status/1283328967555133440?s=09
 

marsh

On TB every waking moment
I had these in my files. I no longer have the links to their original sources. I always found them informational about things repeating themselves.

Last_Glacial_Maximum_Vegetation_Map.svg.png
Extent of glaciation in N. America
Extent_of_Glaciation_in_North_America.png
 

TxGal

Day by day

gfs_T2ma_eu_1-2-e1594890709717.png


CONTINENT-WIDE SUMMER CHILL ENGULFS PRACTICALLY ALL OF EUROPE — “CRICKETS” FROM THE MSM
JULY 16, 2020 CAP ALLON

Over the past few days, Europe has been engulfed by a continent-wide summer chill as brutal Arctic air rode anomalously-far south on the back of a meridional jet stream flow.

Temperature anomalies were forecast to sink by as much as 16C below the seasonal average on Wednesday, July 15–particularly across eastern Europe.

Very few regions were spared, as depicted and predicted by the GFS:

gfs_T2ma_eu_1-1.png

GFS 2m Temp Anomalies (C) for July 15 [tropicaltidbits.com].

Global warming appears to be in charge in Portugal, northern Poland, and parts of Scandinavia; but weather is most definitely ruling the remainder of the continent.

And as we know, the Mainstream Media has no interest in those “blues” and “purples”, and so articles/reports on this record summer chill are hard to come by — if you happen to live in one of the regions that’s experienced an anomalous summer chill of late –so practically anywhere in Europe– I ask that you get in contact and include a link to your local news source, so I can feature it on EV.

The MSM needs its AGW-blinkers removed so it can inform the public rather than merely propagandize. Because the exact opposite of what they’re printing and parroting is barreling down on us — the COLD TIMES are returning, the lower-latitudes are REFREEZING, in line with historically low solar activity, cloud-nucleating Cosmic Rays, and a meridional jet stream flow.

Even NASA appear to agree, if you read between the lines, with their forecast for this upcoming solar cycle (25) seeing it as “the weakest of the past 200 years,” with the agency correlating previous solar shutdowns to prolonged periods of global cooling here.


Prepare accordinglylearn the facts, relocate if need be, and grow your own.
 

TxGal

Day by day


urupema-0-1-e1594886588834.jpg


RECORD COLD HITS SOUTHERN BRAZIL
JULY 16, 2020 CAP ALLON

A cold, recording-breaking past few nights have been suffered across the Rio Grande do Sul and Santa Catarina regions of Brazil, reports noticias.uol.com.br and g1.globo.com.

Thermometers hit double digits BELOW-ZERO.

A bone-chilling -10C (14F) was observed in the mountain settlements of Santa Catarina. Even regions in the lower-lying state of Rio Grande do Sul suffered negative temperatures into the early hours of Tuesday morning.

One reading of -10C (14F) occurred in the rural town of Bom Jardim da Serra, and, after checking the record books, that observation has tied with August 2, 1991 for the areas all-time coldest temperature on record.

With regards to the more urban areas, the lowest minimum on the same day appears to be the -8.8C (16F) in the town of São Joaquim — a further example of the Urban Heat Island effect, if we needed it.


The morning ice and frost in São Joaquim.

Then on Wednesday, July 15, the mercury sank even lower.

As reported by g1.globo.com, the state of Santa Catarina recorded at least 23 municipalities with “minimal negatives and record cold” on July 15.

Urupema, for example, reached a low of –8.1C (17F) and a hard frost swept the region:


Dawn in Urupema was marked by record-cold and hard-frosts [Marleno Muniz Farias].

Over the next few days at least, record-cold and hard-frosts are forecast to continue across the Rio Grande do Sul and mountain ranges of Santa Catarina.

Chile and Argentina also appear set for a long and brutally cold next 10+ days.

The COLD TIMES are returning in line with historically low solar activity, cloud-nucleating Cosmic Rays, and a meridional jet stream flow.

Even NASA appear to agree, if you read between the lines, with their forecast for this upcoming solar cycle (25) seeing it as “the weakest of the past 200 years,” with the agency correlating previous solar shutdowns to prolonged periods of global cooling here.


Prepare accordinglylearn the facts, relocate if need be, and grow your own.
 

Martinhouse

Deceased
Adapt 2030 has another podcast out. It is Part 1/2 of the one posted here yesterday morning.

Reestabishing Global Supply Chains How Much Will it Cost You? With Bob Kudla

rt = 22:23

I haven't listened to it yet so don't know exactly what it's about.
 

TxGal

Day by day
Here's the new podcast from Adapt 2030 that Martinhouse mentioned:

Reestablishing Global Supply Chains How Much Will It Cost You (Bob Kudla 2/2)
2,950 views•Jul 16, 2020

Run time is 22:23

Bob Kudla from Trade Genius and David DuByne of ADAPT 2030 discuss how the record floods in China with a de-pegging of the HK Dollar from the US Dollar will ripple through the global economy causing incredible inflation for food and daily essentials. With that said there are many places that will weather the financial storm which Bob discusses as well.

•Molten Salt Nuclear Plants
•Global Supply Chains constrict
•Physical metals supply chains lock up from mines to bullion delivery
•Reestablishing global supply chains
•Higher wages and higher inflation with new supply chains
•International supply chain electronics goods four weeks lead time
•Dollar strengthening before it collapses
•Greening deserts
•Shifting Southern Hemisphere ice and currents
•GBTC signal trade
 

Martinhouse

Deceased
TxGal, thanks for posting both of these Kudla interviews from Adapt 2030. They aren't really GSM related, but I thought there was some interesting economic/manufacturing ideas that could be thought to be applied to GSM problems.....maybe. After all, the failed harvests of the last few years are being made far, far worse by what is happening to farming and processing supposedly by the whole Covid thing. And to me, that pretty much ties the two situations together.
 

TxGal

Day by day
TxGal, thanks for posting both of these Kudla interviews from Adapt 2030. They aren't really GSM related, but I thought there was some interesting economic/manufacturing ideas that could be thought to be applied to GSM problems.....maybe. After all, the failed harvests of the last few years are being made far, far worse by what is happening to farming and processing supposedly by the whole Covid thing. And to me, that pretty much ties the two situations together.

I agree with you, and just the failed harvests and food situation alone ties in the problems we're all going to be facing with the GSM.
 

TxGal

Day by day

One Thing Is Clear: Solar Minimum Is Here, and it’s one of the Deepest in a Century
By Strange Sounds - Jul 15, 2020

One thing is clear!

Solar Minimum is here, and it’s one of the deepest in a century!

solar cycle update solar minimum mini ice-age
A M1-class solar flare on May 29, 2020–the strongest flare in three years. Credit: NASA/SDO

NOAA has released a new interactive tool to explore the solar cycle, which lets you scroll back through time, comparing sunspot counts now to peaks and valleys of the past.

One thing is clear. Solar Minimum is here, and it’s one of the deepest in a century.

solar cycle update solar minimum mini ice-age
Click to explore almost 300 years of sunspot counts. NOAA

Solar minimum

Solar Minimum is a natural part of the solar cycle. Every ~11 years, the sun transitions from high to low activity and back again. Solar Maximum. Solar Minimum. Repeat.

The cycle was discovered in 1843 by Samuel Heinrich Schwabe, who noticed the pattern after counting sunspots for 17 years. We are now exiting Solar Cycle 24 and entering Solar Cycle 25.

During Solar Minimum, the sun is usually blank, meaning without sunspots. The solar disk often looks like a big orange billiard ball:

solar cycle update solar minimum mini ice-age
The spotless sun on July 14, 2020. Credit: NASA/Solar Dynamics Observatory

2019-2020 a century-class Solar Minimum

In 2019, the sun went 281 days without sunspots, and 2020 is producing spotless suns at about the same rate.

To find a year with fewer sunspots, you have to go all the way back to 1913, which had 311 spotless days.

This makes 2019-2020 a century-class Solar Minimum; solar flares are rare, geomagnetic storms are almost non-existent, and Earth’s upper atmosphere is cooling.


Mini-ice age ahead?

Some people worry that the sun could “get stuck” in Solar Minimum, producing a mini-Ice Age caused by low solar activity. According to scientists, there is no evidence this is happening. On the contrary, the next solar cycle (Solar Cycle 25) is showing unmistakable signs of life.

On May 29th, the sun unleashed the strongest solar flare in years–an M1-class eruption that just missed Earth. The blast came from an active region belonging to Solar Cycle 25.
Observers are also seeing a growing number of Solar Cycle 25 sunspots. So far in 2020, the sun has produced a dozen sunspots. Nine of them (75%) have the magnetic polarity of Solar Cycle 25. This compares to only 17% in 2019 and 0% in 2018. The sun is clearly tipping from one solar cycle to the next.

A NOAA-led panel of experts actually predicted this behaviour. Last year they said that Solar Minimum would hit rock bottom sometime in late 2019-early 2020. Activity would then quicken in 2021-22, ramping up to a new Solar Maximum in 2023-26.

I do think scientists forget the anomalous snow storms and snow quantities that have accumulated in less than 3 weeks of winter in the Andes, among other extreme weather events.
So let’s wait 3-5 more years. Then we will know if those scientists were right or if we are still stuck in the current mini ice-age.
 

TxGal

Day by day

STEVE makes unusual summertime appearance, record breaking solar minimum update

Space Weather
Thu, 16 Jul 2020 21:09 UTC

STEVE
© Harlan Thomas on July 14, 2020 @ West of Calgary, Alberta
STEVE/Picket Fence Aurora, NLC's and Comet NEOWISE

Even STEVE wants to see Comet NEOWISE. On July 14th, the geomagnetic phenomenon appeared over Canada, streaking the sky with mauve ribbons of light. Harlan Thomas of Calgary, Alberta, reports: "I was out shooting the comet when I noticed a mauve-looking cloud. Wow!" I thought. "STEVE has come to visit NEOWISE. How cool is that?"

STEVE is a recent discovery. It looks like an aurora, but it is not. The purple glow is caused by hot (3000°C) ribbons of gas flowing through Earth's magnetosphere at speeds exceeding 6 km/s (13,000 mph). It appears during some geomagnetic storms, often alongside a type of green aurora known as the "picket fence," also shown in Thomas's photo.

Statistics suggest that STEVE appears most often in spring and fall. What summoned STEVE in mid-summer? It may have been a CME that grazed Earth's magnetic field on July 13th. As our planet passed through the CME's magnetized wake on July 14th, hot currents and plasma waves rippled through Earth's magnetosphere. STEVE was the result.

Christy Turner saw it too:

STEVE
© Christy Turner on July 14, 2020 @ Calgary, Alberta
Aurora, Comet Neowise, STEVE

"I was shooting the comet outside Calgary when STEVE started to form," she says. "It was a huge purple pillar--a total delight!"

Many observers across western Canada witnessed the display. During a normal summer, STEVE might have been overlooked, but with Comet NEOWISE drawing photographers outdoors, his visit was well documented. "Summertime STEVE" might be more common than previously thought.

Comment: It's a little insulting to avid skywatchers that they just 'missed' STEVE during summertime, what's likely is that unusual activity in our skies is increasing: "The Dunes": NEW type of aurora discovered, and the unexpected physics behind it.

NOAA has released a new interactive tool to explore the solar cycle. It lets you scroll back through time, comparing sunspot counts now to peaks and valleys of the past. One thing is clear. Solar Minimum is here, and it's one of the deepest in a century.

Comment:
Some experts are saying it's the lowest in 200 years.
Solar Minimum is a natural part of the solar cycle. Every ~11 years, the sun transitions from high to low activity and back again. Solar Maximum. Solar Minimum. Repeat. The cycle was discovered in 1843 by Samuel Heinrich Schwabe, who noticed the pattern after counting sunspots for 17 years. We are now exiting Solar Cycle 24 and entering Solar Cycle 25.

During Solar Minimum, the sun is usually blank-that is, without sunspots. The solar disk often looks like a big orange billiard ball:

sun solar
The spotless sun on July 13, 2020

In 2019, the sun went 281 days without sunspots, and 2020 is producing spotless suns at about the same rate. To find a year with fewer sunspots, you have to go all the way back to 1913, which had 311 spotless days. This makes 2019-2020 a century-class Solar Minimum; solar flares are rare, geomagnetic storms are almost non-existent, and Earth's upper atmosphere is cooling.

Some people worry that the sun could "get stuck" in Solar Minimum, producing a mini-Ice Age caused by low solar activity. There is no evidence this is happening. On the contrary, the next solar cycle (Solar Cycle 25) is showing unmistakable signs of life.

Comment: There is an abundance of evidence the planet is cooling, see: here, here, here, here, here - for an idea of just a few of the proofs.

On May 29th, the sun unleashed the strongest solar flare in years-an M1-class eruption that just missed Earth. The blast came from an active region belonging to Solar Cycle 25.

An M1-class solar flare on May 29, 2020-the strongest flare in three years.

Observers are also seeing a growing number of Solar Cycle 25 sunspots. So far in 2020, the sun has produced a dozen sunspots. Nine of them (75%) have the magnetic polarity of Solar Cycle 25. This compares to only 17% in 2019 and 0% in 2018. The sun is clearly tipping from one solar cycle to the next.

A NOAA-led panel of experts actually predicted this behaviour. Last year they said that Solar Minimum would hit rock bottom sometime in late 2019-early 2020. Activity would then quicken in 2021-22, ramping up to a new Solar Maximum in 2023-26.

So far, so good.

Comment: If only all we had to worry about was an Ice Age, because discoveries like STEVE are just the tip of the ice berg when it comes to the unusual phenomena that reflects the shift occurring on our planet - and even further afield:
Also check out SOTT radio's:
And SOTT's Earth Changes Summary - May 2020: Extreme Weather, Planetary Upheaval, Meteor Fireball

View: https://youtu.be/opPXpuC6n58
 
Last edited:

TxGal

Day by day

Farmland once again inundated in Tangail, Bangladesh - 50,000 hectares of crops damaged

Abdullah Al Numan
Dhaka Tribune
Tue, 14 Jul 2020 20:32 UTC

Floodwater reached houses in Rulipara village under Gabsara union of Tangail's Bhuapur upazila on Tuesday, July 14, 2020
© Dhaka Tribune
Floodwater reached houses in Rulipara village under Gabsara union of Tangail's Bhuapur upazila on Tuesday, July 14, 2020

Altogether 25 unions in Sadar, Nagarpur, Delduar, Bhuapur, Kalihati and Gopalpur upazilas were flooded

About 1,320 hectares of fresh farmland have once again been inundated amid the ongoing flooding situation, triggered for a second time by incessant rains and water level rise of the major rivers in Tangail.

Previously, during the first phase that ended a few days ago, around 27,000 farmers incurred losses as crops on 3,839 hectares were inundated, according to the Department of Agricultural Extension (DAE) in Tangail.

On Tuesday morning, the Jamuna, Jhinai and Dhaleshwari was flowing 35cm, 19cm and 67cm respectively above the danger mark at three different points in Tangail, according to Deputy Assistant Engineer Rezaul Karim of the Water Development Board (WDB) in Tangail.

View: https://youtu.be/1MJHk33pzlo


He said incessant rains had been causing the rivers to flow above the danger mark, a trend that might continue in the coming days.

Ahsanul Bashar, deputy director of the DAE in Tangail, said farmland near the river banks had sustained the most damage. "Crops in 3,839 hectares of land have already sustained damage against a total of 50,000 hectares in the district.

"Young plants, sesame and vegetables sustain the most damage in floods," said Ahsan
, adding that most of the crops would not have to deal with much harm.

"We will try to make up for the damage dealt to paddy this season through cultivating more in the next season. The agriculture office will try its best in this regard. A list of flood affected farmers has been sent to the concerning ministry so that they are supported," the agriculture officer further said.

According to sources from the district's relief and rehabilitation office, 141 villages in altogether 25 unions in Sadar, Nagarpur, Delduar, Bhuapur, Kalihati and Gopalpur upazilas have been flooded.

Meanwhile, 84,712 people in Elenga municipality of Kalihati upazila were marooned as of Tuesday afternoon.

Till now, the government has allocated 400 tons of rice, and Tk8 lakh in cash for the flood-affected people of the district. Moreover, baby food worth Tk2 lakh, fodder worth Tk2 lakh and 4,000 packets of dried food were allocated.

Comment: Also pertinent: Third of Bangladesh underwater, at least 1.5 million people affected
 

TheSearcher

Are you sure about that?

TxGal

Day by day

Rockies-e1594977512742.jpg


HISTORICALLY COLD START TO SUMMER FOR THE NORTHWEST AND NORTHERN ROCKIES
JULY 17, 2020 CAP ALLON

While pockets of anomalous heat have lingered in the south, the majority of the United States has suffered a colder-than-average start to summer 2020 — continuing North America’s 2015-to-present cooling trend.

As of Thursday, a number of locations have still to reach 90F (32.2C) this year, including Spokane, Washington, and Great Falls, Montana, reports weather.com.

The latest date for the first 90-degree reading for the cities is July 21 and July 29, respectively–meaning this year will be one of the latest first 90-degree temperatures on record, perhaps even the latest.

Additionally, the first half of July is off to one of the coldest starts on record in both Cut Bank, Montana, and Olympia, Washington.

Cool temperatures have also prevailed in Seattle.

A 17-day streak of below-average temperatures ended July 14 (see below tweet). Highs were generally in the 60s and lower 70s during this period.

View: https://twitter.com/NWSSeattle/status/1283037436159897600


The MSM are trying to paint what used to be considered normal summer temperatures as something we should all be concerned with. They claim more than three quarters of the US is currently under an unprecedented, record-breaking “heat dome” — but this simply isn’t the case:


GFS 2m Temp Anomalies for July 14 [tropicaltidbits.com]


GFS 2m Temp Anomalies for July 16 [tropicaltidbits.com]

And look at the below forecast highs from weather.com for the coming weekend. Despite the obfuscating choice of color pallet, these are average temps for the time of year — some a little above, some a little below — nothing to write home about, and certainly no evidence of that EOTW heat dome:


[weather.com]

Furthermore, a cool down for central and eastern parts looks set to roll-in during the first half of next week.

And while this pattern-shift means rising temps for the NW, much of the rest of the CONUS will suffer below-average summer chills — something the “one-side of a story” MSM will no-doubt ignore, and so, in turn, the alarmists will never hear about:

gfs_T2ma_us_fh90-138-1.gif

GFS 2m Temp Anomalies for July 20 – July 22

If you read the MSM then you’re being propagandized (all sides) — and you likely already fully-agree with whatever angle the source has decided to take.

This is not informing yourself. This is not opening your mind. This is living in an echo-chamber. Pointless. And particularly in the case of the sciences, there is never one side of a story–nothing is ever settled. A question or query should be embraced, not feared; debate should be rife, not stifled.

The COLD TIMES are likely returning, in line with historically low solar activity, cloud-nucleating Cosmic Rays, and a meridional jet stream flow.

Even NASA appear to agree, if you read between the lines, with their forecast for this upcoming solar cycle (25) seeing it as “the weakest of the past 200 years,” with the agency correlating previous solar shutdowns to prolonged periods of global cooling here.


Prepare accordinglylearn the facts, relocate if need be, and grow your own.
 

Martinhouse

Deceased
Adapt 2030 has a new video up. It runs 28:11 minutes

It is not about the GSM, it is about digital ID and it is scarier than hell and it would be a good idea for everyone to listen to it. I am not the least bit interested in things like digital IDs and BitCoin and other digital money.....all that sort of thing.....but I am going to listen to this video again, possibly even twice more, because if it's true, to me it's scarier than the worst ice age or pandemic I can imagine.
 

TxGal

Day by day
Adapt 2030 has a new video up. It runs 28:11 minutes

It is not about the GSM, it is about digital ID and it is scarier than hell and it would be a good idea for everyone to listen to it. I am not the least bit interested in things like digital IDs and BitCoin and other digital money.....all that sort of thing.....but I am going to listen to this video again, possibly even twice more, because if it's true, to me it's scarier than the worst ice age or pandemic I can imagine.

Good grief, more ominous news! I'll post it in just a sec, thanks!!
 

TxGal

Day by day
Here's the podcast Martinhouse mentioned above:

View: https://www.youtube.com/watch?v=F1EVs2GMsRg


What Will Be Required For You To Move in Society 2021 Forward (1013)
3,080 views•Jul 17, 2020

Run time is 28:11

To move through society beginning 2021 you will be required to have a "Self Sovereign Identity" issued by a corporation in the Covid Credentials Initiative (CCI) where you will be tagged in the Trust Over IP Foundation's "person under guardianship" through the Identity for All Council (I4A), just to have a job or enter a supermarket. The best part is that you will need to pay monthly to keep your credentials active. Central Bank Digital Currency will be deposited into your cloud based digital wallet.
 

TheSearcher

Are you sure about that?
Adapt 2030 has a new video up. It runs 28:11 minutes

It is not about the GSM, it is about digital ID and it is scarier than hell and it would be a good idea for everyone to listen to it. I am not the least bit interested in things like digital IDs and BitCoin and other digital money.....all that sort of thing.....but I am going to listen to this video again, possibly even twice more, because if it's true, to me it's scarier than the worst ice age or pandemic I can imagine.

To keep the drift a little longer: This is the doorway into Skynet. These companies are thinking they can entangle all of us in a digital web, but they'll be entangled, too. A sufficiently-advanced AI can take control of the whole thing, then all of humanity is chained. With autonomous physical systems, many of which are mobile, resistance will be very, very difficult.

These systems are driven by avarice and megalomania, and the creators are blind to the dangers to themselves.
 
Top