Solar Grand Solar Minimum part deux

TxGal

Day by day
Still nothing since 3 August on Ice Age Now. I'm guessing they're having difficulties keeping it going since Robert Felix's passing.
 

TxGal

Day by day
Adapt 2030 has a new podcast out about the continuing supply shortages. Posting since this will impact food and other items going forward, as preps for GSM-related issues:

Shutoff of the World's Supplies - YouTube

Shutoff of the World's Supplies
14,940 views
Premiered 9 hours ago


View: https://youtu.be/KC48jmXNWHk
Run time is 9:30

Synopisis provided:

Our global supply chains are grinding to a halt because they are overloaded and at the breaking point, which is strange since a huge percent of businesses went under in the last 18 months, but demand for everything across the world is at all time highs. There seems to be a disconnect. At least Bitcoin is being mined with hydropower from the USA's oldest powerplant.
 

TxGal

Day by day
The Oppenheimer Ranch Project has a new one:

What Is The Cosmic Catastrophe Cycle? Magnetic Reversals vs Pole Flip - Proxy Data Explained - YouTube

What Is The Cosmic Catastrophe Cycle? Magnetic Reversals vs Pole Flip - Proxy Data Explained
2,933 views
Aug 16, 2021


View: https://youtu.be/1GQxAf0z_sc
Run time is 16:51

Synopsis provided:

How do we know about a cosmic clock cycle? What is the evidence? Where does it come from? All these questions will be answered in an easily digestible manner. Enjoy!
Known Magnetic Excursions https://bit.ly/3k6AubE
Cosmic Catastrophe Cycle https://bit.ly/3soZjmT
Geomagnetic reversal https://bit.ly/2VWEMK4
Earths Magnetic Field Intensity https://go.nasa.gov/2Unddcq
Rock magnetism: measuring techniques and apparatus https://bit.ly/3yWOM4w
Magnetic methods are based upon measuring the magnetic effects produced by varying concentrations of ferromagnetic minerals, such as magnetite, in geological formations. https://bit.ly/3AM4Uqb
Sea-Surface Characteristics of the Newfoundland Basin of the Northwest Atlantic Ocean during the Last 145,000 Years: A Study Based on the Sedimentological and Paleontological Proxies https://bit.ly/3iS08kP
Benthic Foraminifera and Diatoms as Ecological Indicators https://bit.ly/3m5RuBi
 

TxGal

Day by day
New Study: 23 Experts in the fields of Solar Physics and Climate Science Contradict the IPCC -- the Science is NOT Settled (electroverse.net)

cityscape-SUN.jpg

Articles

NEW STUDY: 23 EXPERTS IN THE FIELDS OF SOLAR PHYSICS AND CLIMATE SCIENCE CONTRADICT THE IPCC — THE SCIENCE IS NOT SETTLED
AUGUST 16, 2021 CAP ALLON

A diverse expert panel of global scientists finds blaming climate change mostly on greenhouse gas emissions was premature. Their findings contradict the UN IPCC’s conclusion, which the study shows, is grounded in narrow and incomplete data about the Sun’s total solar irradiance (TSI).


Most of the energy in the Earth’s atmosphere comes from the Sun. It has long been recognized that changes in the so-called “total solar irradiance” (TSI), i.e., the amount of energy emitted by the Sun, over the last few centuries, could have contributed substantially to recent climate change. However, this new study found that the UN’s Intergovernmental Panel on Climate Change (IPCC) only considered a small subset of the published TSI datasets when they were assessing the role of the Sun in climate change and that this subset only included “low solar variability” datasets. As a result, the IPCC was premature in ruling out a substantial role for the Sun in recent climate change.

A new scientific review article has just been published on the role of the Sun in climate change over the last 150 years.

It finds that the United Nations’ Intergovernmental Panel on Climate Change (IPCC) may have been premature in their conclusion that recent climate change is mostly caused by human greenhouse gas emissions.

The paper by 23 experts in the fields of solar physics and of climate science from 14 different countries is published in the peer-reviewed journal Research in Astronomy and Astrophysics (RAA).

The paper, which is the most comprehensive to date, carries out an analysis of the 16 most prominent published solar output datasets, including those used by the IPCC.

The researchers compared them to 26 different estimates of Northern Hemisphere temperature trends since the 19th century (sorted into five categories), including the datasets used by the IPCC.

They focused on the Northern Hemisphere since the available data for the early 20th century and earlier is much more limited for the Southern Hemisphere, but their results can be generalized for global temperatures.


How much has the Sun influenced Northern Hemisphere temperature trends? (click the image to enlarge)

The study found that scientists come to opposite conclusions about the causes of recent climate change depending on which datasets they consider.

For instance, in the graphs above, the panels on the left lead to the conclusion that global temperature changes since the mid-19th century have been mostly due to human-caused emissions, especially carbon dioxide (CO2), i.e., the conclusion reached by the UN IPCC reports.

In contrast, the panels on the right lead to the exact opposite conclusion, i.e., that the global temperature changes since the mid-19th century have been mostly due to natural cycles, chiefly long-term changes in the energy emitted by the Sun.

Both sets of panels are based on published scientific data, but each uses different datasets and assumptions.

On the left, it is assumed that the available temperature records are unaffected by the urban heat island problem, and so all stations are used, whether urban or rural.

On the right, only rural stations are used.

Meanwhile, on the left, solar output is modeled using the low variability dataset that has been chosen for the IPCC’s upcoming (in 2021/2022) 6th Assessment Reports. This implies zero contribution from natural factors to the long-term warming.

On the right, solar output is modeled using a high variability dataset used by the team in charge of NASA’s ACRIM sun-monitoring satellites. This implies that most, if not all, of the long-term temperature changes are due to natural factors.

Dr. Ronan Connolly, lead author of the study, at the Center for Environmental Research and Earth Sciences (CERES):

“The IPCC is mandated to find a consensus on the causes of climate change. I understand the political usefulness of having a consensus view in that it makes things easier for politicians. However, science doesn’t work by consensus. In fact, science thrives best when scientists are allowed to disagree with each other and to investigate the various reasons for disagreement. I fear that by effectively only considering the datasets and studies that support their chosen narrative, the IPCC have seriously hampered scientific progress into genuinely understanding the causes of recent and future climate change. I am particularly disturbed by their inability to satisfactorily explain the rural temperature trends.”

The 72 page review (18 figures, 2 tables and 544 references) explicitly avoided the IPCC’s consensus-driven approach in that the authors agreed to emphasize where dissenting scientific opinions exist as well as where there is scientific agreement.

Indeed, each of the co-authors has different scientific opinions on many of the issues discussed, but they agreed for this paper to fairly present the competing arguments among the scientific community for each of these issues, and let the reader make up their own mind.

Several co-authors spoke of how this process of objectively reviewing the pros and cons of competing scientific arguments for the paper has given them fresh ideas for their own future research. The authors also spoke of how the IPCC reports would have more scientific validity if the IPCC started to adopt this non-consensus driven approach.

The full citation for the study, and indeed the study itself, can be found HERE.

QUOTES FROM SOME OF THE OTHER CO-AUTHORS

Víctor Manuel Velasco Herrera, Professor of Theoretical Physics and Geophysics at the National Autonomous University of Mexico (UNAM) said:

“This paper is very special in that all 23 co-authors set aside our research directions and specialties to produce a fair and balanced scientific review on the subject of sun-climate connections that the UN IPCC reports had mostly missed or simply neglected.”

Nicola Scafetta, Professor of Oceanography and Atmospheric Physics at the University of Naples Federico II (Italy):

“The possible contribution of the sun to the 20th-century global warming greatly depends on the specific solar and climatic records that are adopted for the analysis. The issue is crucial because the current claim of the IPCC that the sun has had a negligible effect on the post-industrial climate warming is only based on global circulation model predictions that are compared against climatic records, which are likely affected by non-climatic warming biases (such as those related to the urbanization), and that are produced using solar forcing functions, which are obtained with total solar irradiance records that present the smallest secular variability (while ignoring the solar studies pointing to a much larger solar variability that show also a different modulation that better correlates with the climatic ones). The consequence of such an approach is that the natural component of climate change is minimized, while the anthropogenic one is maximized. Both solar and climate scientists will find the RAA study useful and timely, as it highlights and addresses this very issue.”

Ole Humlum, Emeritus Professor of Physical Geography at the University of Oslo, Norway:

“This study clearly demonstrates the high importance of carefully looking into all aspects of all available data. Obviously, the old saying ‘Nullius in verba’ is still highly relevant in modern climate research.”

Gregory Henry, Senior Research Scientist in Astronomy, from Tennessee State University’s Center of Excellence in Information Systems (U.S.A.):

“During the past three decades, I have acquired highly precise measurements of brightness changes in over 300 Sun-like stars with a fleet of robotic telescopes developed for this purpose. The data show that, as Sun-like stars age, their rotation slows, and thus their magnetic activity and brightness variability decrease. Stars similar in age and mass to our Sun show brightness changes comparable to the Sun’s and would be expected to affect climate change in their own planetary systems.”

Valery M. Fedorov, at the Faculty of Geography in Lomonosov Moscow State University, Russia:

“The study of global climate change critically needs an analytical review of scientific studies of solar radiation variations associated with the Earth’s orbital motion that could help to determine the role and contributions of solar radiation variations of different physical natures to long-term climate changes. This paper steers the scientific priority in the right direction.”

Richard C. Willson, Principal Investigator in charge of NASA’s ACRIM series of Sun-monitoring Total Solar Irradiance satellite experiments (U.S.A.):

“Contrary to the findings of the IPCC, scientific observations in recent decades have demonstrated that there is no ‘climate change crisis’. The concept that’s devolved into the failed CO2 anthropogenic global warming (CAGW) hypothesis is based on the flawed predictions of imprecise 1980’s vintage global circulation models that have failed to match observational data both since and prior to their fabrication.

The Earth’s climate is determined primarily by the radiation it receives from the Sun. The amount of solar radiation the Earth receives has natural variabilities caused by both variations in the intrinsic amount of radiation emitted by the Sun and by variations in the Earth-Sun geometry caused by planetary rotational and orbital variations. Together these natural variations cause the Total Solar Irradiance (TSI) at the Earth to vary cyclically on a number of known periodicities that are synchronized with known past climatic changes.”


WeiJia Zhang, Professor of Physics at Shaoxing University (China) and a Fellow of the Royal Astronomical Society (UK):

“The quest to understand how the Earth’s climate is connected to the Sun is one of the oldest science subjects studied by the ancient Greeks and Chinese. This review paper blows open the mystery and explains why it has been so difficult to make scientific advances so far. It will take the real understanding of fluid dynamics and magnetism on both the Sun and Earth to find the next big leap forward.”

Hong Yan (晏宏), Professor of Geology and Paleoclimatology at the Institute of Earth Environment and Vice Director of the State Key Laboratory of Loess and Quaternary Geology in Xi’an, China:

“Paleoclimate evidence has long been informing us of the large natural variations of local, regional and hemispheric climate on decadal, multidecadal to centennial timescales. This paper will be a great scientific guide on how we can study the broad topic of natural climatic changes from the unique perspective of external forcings by the Sun’s multi-scale and multi-wavelength impacts and responses.”

Ana G. Elias, Director of the Laboratorio de Ionosfera, Atmósfera Neutra y Magnetosfera (LIANM) at the Facultad de Ciencias Exactas y Tecnología in the Universidad Nacional de Tucumán (FACET-UNT), Argentina:

“The importance of this work lies in presenting a broader perspective, showing that all the relevant long-term trend climate variability forcings, and not just the anthropogenic ones (as has been done mostly), must be considered. The way in which the role of these forcings is estimated, such as the case of solar and geomagnetic activity, is also important, without minimizing any one in pursuit of another. Even the Earth’s magnetic field could play a role in climate.”

Willie Soon, at the Center for Environmental Research and Earth Sciences (CERES), who also has been researching sun/climate relationships at the Harvard-Smithsonian Center for Astrophysics (U.S.A.) since 1991:

“We know that the Sun is the primary source of energy for the Earth’s atmosphere. So, it always was an obvious potential contributor to recent climate change. My own research over the last 31 years into the behavior of stars that are similar to our Sun, shows that solar variability is the norm, not the exception. For this reason, the Sun’s role in recent climate change should never have been as systematically undermined as it was by the IPCC’s reports. Hopefully, this systematic review of the many unresolved and ongoing challenges and complexities of Sun/climate relationships can help the scientific community return to a more comprehensive and realistic approach to understanding climate change.”

László Szarka, from the ELKH Institute of Earth Physics and Space Science (Hungary) and also a member of the Hungarian Academy of Sciences:

“This review is a crucial milestone on the way to restoring the scientific definition of ‘climate change’ that has become gradually distorted over the last three decades. The scientific community should finally realize that in science there is no authority or consensus; only the right to seek the truth.”

The science is settled, right? That’s what we’re led to believe?

Well no, even that statement is a lie, and these 23 eminent solar physicists and climate scientists are evidence of that–they are putting their reputations -and in some cases their careers- on the line to share with you their findings. Help their voices grow louder by spreading their message. Give others in your ‘circle of influence’ -to steal a gross climate change trope– the opportunity to become awakened, and to discover the true meaning of scientific endeavor: question everything.
 

TxGal

Day by day
"Unseasonal" Snow Blasts Kashmir, South Africa's Food Prices Soar due to Extreme Freeze, European Crop Woes, + Rare Low-Level Snow Hits Tasmania - Electroverse

Snow-Tasmania-Aug-e1629193383708.png

Crop Loss Extreme Weather GSM

“UNSEASONAL” SNOW BLASTS KASHMIR, SOUTH AFRICA’S FOOD PRICES SOAR DUE TO EXTREME FREEZE, EUROPEAN CROP WOES, + RARE LOW-LEVEL SNOW HITS TASMANIA
AUGUST 17, 2021 CAP ALLON

The MSM appear to be stepping up the EOTW rhetoric of late–if that’s even possible.

A seemingly never-ending barrage of ‘catastrophic global heating’ articles are peppering the western world’s news feeds, and the brainwashed masses continue to fall for every single word of it.

I used to think a journalist’s job was to report the truth, and to provide balance and impartiality — I was naive.
The Smith-Mundt Modernization Act put pay to that.

“UNSEASONAL” SNOW HITS KASHMIR

The higher elevations of India’s Kashmir region reported heavy snowfall and a considerable dip in temperatures on Sunday, according to local meteorologists, and as reported by kashmirreader.com.

The rare summer snowfall was registered at Amarnath cave, as well as the higher reaches of Sonamarg.

“There are also reports of snowfall in the mountainous ranges of Drass in the Union Territory of Ladakh,” said one local meteorologist. Heavy snow has also been noted at Gulmarg, which is located in North Kashmir’s Baramulla district.

View: https://twitter.com/Muneeb93787779/status/1427202859884433411

Run time is 0:30

India has been no stranger to anomalous cold in recent times.

The nation has been breaking low temperature records left, right and center in 2021; in fact, since August 2020, Delhi has busted at least one major weather record each and every month.

Predictably, the indoctrinated among us are keen to blame this feat on ‘global heating’ and ‘rising atmospheric CO2 levels’–even though the majority of the fallen benchmarks have been cold-related.

In October last year, Delhi broke a 58-year-old record, clocking a mean minimum temperature of 17.2C (63F):


In November, the month’s mean minimum temperature dropped to 10.2C (50F)–a level not seen in 1949.

December witnessed 8 ‘cold wave days’–the highest since 1965. The final month of 2020 also went down as the second-coldest since 1901, and contained its coldest December day since records began more than a century ago.

New cold records have been set in 2021, too.

In January, record snowfall cut-off Kashmir from the rest of the country.

Delhi then went on to suffer its coldest May day in 70 years when a high of just 23.8C (74.8F) was registered on May 19–a reading that went down as the city’s coldest May day since 1951, and one some 16C below the seasonal average:


And in June, India’s capital Delhi suffered its coldest June temperature ever recorded:


These are hardly signs of ‘catastrophic global heating’. But they went unreported by the MSM –as cold-related realities often do– meaning the masses were never privy to ‘the other side’ of the climate story.

SOUTH AFRICA’S FOOD PRICES SOAR DUE TO EXTREME FREEZE

Snow is continuing to fall over the higher elevations of South Africa, including Lesotho where guests at the Afriski Mountain Resort were treated to “incredible snow conditions this weekend,” according to thesouthafrican.com.

Heavy snow forced the closure of roads and passes in KwaZulu-Natal and Eastern Cape on Saturday.

While Afriski Mountain Resort in Lesotho received 5cm (2 inches) of global warming goodness on Saturday, and then a further 20cm (8 inches) on Sunday — totals that closed the roads there, too.

View: https://twitter.com/SkiAfriski/status/1426796948888203264

Run time is 0:15

Snow seekers have been treated to dream conditions this year, with this the third reported snowfall in the space of two months, continues thesouthafrican.com article.

View: https://twitter.com/SkiAfriski/status/1426794675441217538


Similar to India, South Africa has been no stranger to extreme harvest-wrecking chills of late.

Heavy snow has been a common theme across the mountains.

While just last month, an severe Antarctic blast toppled at least 19 all-time low temperature records:


As a result of these prolonged low temperatures, South Africa’s food prices have been on the rise.

According to businessinsider.co.za, the extreme freezes suffered by regions across SA, inducing Limpopo, have resulted in severe damage to crops including spinach, tomatoes, and peppers. The upshot of this has been a sharp decline of deliveries to fresh produce markets which, in turn, has resulted in prices soaring by at east 20%.

Spinach was the worst affected vegetable, with the price rocketing 27% to R5.13 per kilogram in a just one week. Tomatoes are up 23% to R8.09 per kilogram. While Peppers now cost R11.97, a spike of 20%.

Pieter van Zyl, market analyst for AMT, said the full impact of the recent frost damage is yet to be felt.

“Last week was the third week in a row where tomato prices have risen,” said Zyl.

“Pepper sales have been moving sideways over the past three weeks; however, last week the price rose quite sharply. Many [were] damaged due to the frost … and late last week, producers sent fewer products to the markets,” added Zyl.

Strike Sebake, an agent for Tshwane Market, said even the tomatoes that are making it to the shelves are often not of good quality.While, according to Sebake, other vegetables spiking are baby marrows, green beans, chilies, and okra.

EUROPEAN CROP WOES

Adverse weather in the European Union has sharply reduced prospects for wheat and barley harvests, contributing to a potentially ‘explosive’ global supply outlook for the cereals, analyst firm Strategie Grains said.

In a monthly report, Strategie Grains reduced its forecast for 2021 soft wheat production in the 27-country EU by 1.5 million tonnes. This reduction has been blamed on the historic flooding in the run-up to harvesting, which has led to disappointing yields in France and Germany. High temperatures in June lowered yields in Poland and northern Europe. While cold conditions across Western Europe in July have hampered growing efforts there.

The recent downgrade, which is by no means disastrous on its own, comes as harvest prospects have also deteriorated in other major exporting regions, such as North America, South America, South Africa, and the Black Sea region (among others).

As a result, Strategie Grains reduced its estimates of world wheat production, including durum, by 14 million tonnes to 750.3 million tonnes, with further reductions all-but guaranteed.

Global wheat demand is expected to expand in 2021/22, and this, combined with the failing harvests, could lead to the stocks-to-use ratio in major exporting countries falling to its second-lowest level on record, after 2012/13, Strategie Grains said.

Moreover, the quality is also expected to be lower, reflecting the impact of the inclement weather — as a result, the share of livestock feed-grade crop in the soft wheat harvest was expected to be substantially higher.

Projected EU barley production was lowered again, by 2 million tonnes from July to 53.0 million tonnes, contributing to a 7 million tonne cut to Strategie Grains’ forecast of global barley output.

These global shortages –which include freezes in South America and droughts in Canada– are threatening “explosive situations for barley and wheat” markets, said Strategie Grains.

It isn’t only grains being negatively impacted, the quality of harvests in Belgium this year, from grains to fruit and vegetables, has been affected by a cold spring with little sun and then constant heavy rain throughout the summer.

The effects are being felt across the board, with most crops –from pears, the fruit most grown in Belgium, to cereals and the country’s other signature crop, potatoes– reeling from the adverse weather conditions, reports freshplaza.com.

This year’s yield of pears, for example, is expected to be about 25% lower than in 2020.

“This is due to frost early in the season, in some places, but also to the poor weather conditions, which prevent a good pollination of the flowers,” Olivier Warnier of the Centre fruitier Wallon told Belga News Agency.

“The coming harvest could be the lowest in 10, 15 years,” said Warnier, who added that the drop in production would bolster prices. A dark, cold spell in late May also caused many of the baby fruit to fall, the expert said.

Another major European grower of pears, the Netherlands, is also bracing for a poor harvest, and the situation is even worse for the continent’s No. 1 producer, Italy.

Belgium cherries are also in trouble.

“For the Morello cherry, it’s been catastrophic,” said Warner, stressing that sweet cherry losses are about 50% to 100%.

RARE LOW-LEVEL SNOW HITS TASMANIA

And finally, snow fell to 400m (1,300ft) in southern Tasmania Monday morning, and to 600m (19,70ft) in the north of the state, transforming the Australian state into “a winter wonderland,” according to abc.net.au.

Collinsvale
, north-west of Hobart, and kunanyi/Mt Wellington were both blanketed by a substantial dose of global warming goodness, while Tod’s Corner in the Central Highlands received accumulations of more than 15cm (5.9 inches).
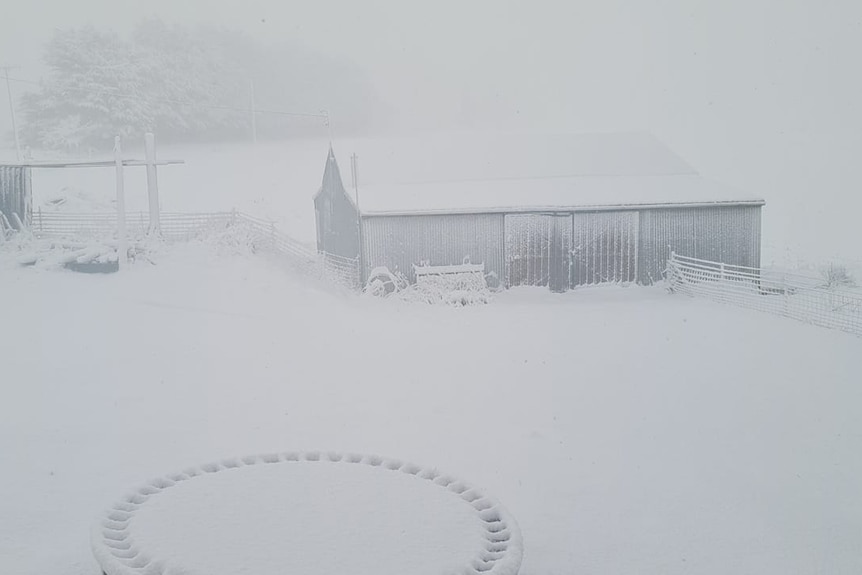
Reader pic of snow at Collins Cap, Collinsvale Tasmani. August 16, 2021.
Collins Cap at Collinsvale blanketed in heavy snow [Lily Taylor].

Meteorologist Luke Johnston said the snowfall was brought about by an Antarctic front that caused “damaging and destructive north-westerly wind gusts” on Sunday.

“Vigorous cold fronts of this magnitude that bring damaging winds and snowfalls to low levels are relatively rare,” added Johnston. And while Tasmania does indeed experience dozens of cold fronts each year, they are usually “much less significant than the one that passed on the weekend,” said Johnston.

Rachel Power, who owns the Mt Field’s Waterfalls Cafe, north-west of Hobart, said the recent snow was “absolutely amazing”.

Australian Snow Season Outlook, July Update- Dare To Dream | Mountainwatch

Also, check out yesterday’s later than usual article, if you haven’t already:


The COLD TIMES are returning, the mid-latitudes are REFREEZING, in line with the great conjunction, historically low solar activity, cloud-nucleating Cosmic Rays, and a meridional jet stream flow (among other forcings).

Both NOAA and NASA appear to agree, if you read between the lines, with NOAA saying we’re entering a ‘full-blown’ Grand Solar Minimum in the late-2020s, and NASA seeing this upcoming solar cycle (25) as “the weakest of the past 200 years”, with the agency correlating previous solar shutdowns to prolonged periods of global cooling here.

Furthermore, we can’t ignore the slew of new scientific papers stating the immense impact The Beaufort Gyre could have on the Gulf Stream, and therefore the climate overall.


Prepare accordinglylearn the facts, relocate if need be, and grow your own.
 

TxGal

Day by day
Fall-Like Arctic Front to Grip much of North America: Snow Forecast for Montana, Wyoming, Utah and Colorado (electroverse.net)

summer-spanner-e1629277659184.jpg

Extreme Weather GSM

FALL-LIKE ARCTIC FRONT TO GRIP MUCH OF NORTH AMERICA: SNOW FORECAST FOR MONTANA, WYOMING, UTAH AND COLORADO
AUGUST 18, 2021 CAP ALLON

An unusually cold storm system will move into the Pacific Northwest this week, driving temperatures down some 6C-16C below the seasonal average, and bringing a substantial dusting of summer snow to the mountains.

The latest GFS runs (below) show a mass of Arctic air sinking down from Alaska and Canada, starting today.

AUG 18:

GFS 2m Temperature Anomalies (C) Aug 18 [tropicaltidbits.com].

That mass of “blue” and “purple” will intensify and expand southward and eastward into Thursday:


GFS 2m Temperature Anomalies (C) Aug 19 [tropicaltidbits.com].

Where it will then linger well into the weekend:

AUG 20:

GFS 2m Temperature Anomalies (C) Aug 20 [tropicaltidbits.com].

AUG 21:
gfs_T2ma_namer_16.png

GFS 2m Temperature Anomalies (C) Aug 21 [tropicaltidbits.com].

This is something of ‘summer spanner’ in the AGW works.

The MSM has been milking the Pacific Northwest’s heat for all it’s worth in recent weeks. But now, we get to sit back and enjoy them squirm and obfuscate their way through a record-breaking bout of August cold.

Supporting this looming fall-like cool-down is NOAA’s latest 6-10 Day Temperature Outlook.

The outlook, released Sunday from the agency’s Climate Prediction Center, confirms that “colder than normal” conditions will impact a large part of the northern Rockies, including Colorado and Utah. Some places in Montana are expected to see highs only in the 40s over the next few days, with lows in the 30s — such readings would threaten all-time August lows.

And you best take heed when the likes of NOAA are telling you it’s going to get cold. The agency has a provable warm-bias. We all recall their swing and a miss for February, 2021: “A warmer than average month,” was the agency’s official prediction; but in reality, North America suffered its coldest February since the 1980s which in turn led to the deaths of 702 people in Texas alone–many of them likely unprepared due to the false, warm-mongering forecast.


Alaska has already seen substantial summer flurries this week.

Below are shots North Central Alaska on Aug 17, courtesy of @AndySteinWx on Twitter:

  • E9AhnCMVoAM0Cpm.jpg
  • E9AhnDTVkAEo4Fk.jpg
That high-latitude snow will track southward with the cold.

Noteworthy totals are forecast to develop across the higher elevations of Montana, Wyoming and Colorado–and while the snow levels are expected to remain high, such widespread summer accumulations are not common.

Below is the latest ‘GFS Total Snowfall’ run.

Note also the healthy early-season totals building above the border, in British Columbia.

AUG 18 – AUG 23:

GFS Total Snowfall (inches) Aug 18 – Aug 23 [tropicaltidbits.com].

This looks to be more than just a dusting.

We will likely be measuring totals in the inches across the peaks.

Stay tuned for updates.

FURTHER READING:


The COLD TIMES are returning, the mid-latitudes are REFREEZING, in line with the great conjunction, historically low solar activity, cloud-nucleating Cosmic Rays, and a meridional jet stream flow (among other forcings).

Both NOAA and NASA appear to agree, if you read between the lines, with NOAA saying we’re entering a ‘full-blown’ Grand Solar Minimum in the late-2020s, and NASA seeing this upcoming solar cycle (25) as “the weakest of the past 200 years”, with the agency correlating previous solar shutdowns to prolonged periods of global cooling here.

Furthermore, we can’t ignore the slew of new scientific papers stating the immense impact The Beaufort Gyre could have on the Gulf Stream, and therefore the climate overall.


Prepare accordinglylearn the facts, relocate if need be, and grow your own.
 

TxGal

Day by day
From the Oppenheimer Ranch Project:

Caldor Fire Explodes! Remnants Of Fred Linger In The Northeast - Record Cold - Crestone Energy Fair - YouTube

Caldor Fire Explodes! Remnants Of Fred Linger In The Northeast - Record Cold - Crestone Energy Fair
3,107 views
Premiered 7 hours ago

View: https://youtu.be/zdL-quutNMw
Run time is 14:19

Synopsis provided:

Northern California wildfire triples in size, forcing thousands to evacuate https://cnn.it/3mfVYoU
Caldor Fire prompts evacuations east of Placerville, California https://bit.ly/3meKhPj
Satellite video shows the "explosive growth" of the Caldor Fire in California https://cbsn.ws/3mgkvKM
tracking the explosive growth of the #CaldorFire last evening, seen here burning east of Sacramento, California. https://bit.ly/3CZq8mp
Tropical Storm Fred continue to move inland and up the east coast https://bit.ly/3ATFEhU
National Hurricane Center https://www.nhc.noaa.gov/
Severe Weather Outlook For Thursday-Friday https://bit.ly/3iYHCqX
60 miles per hour, large hail, and flash flooding In Wyoming https://bit.ly/3AY6up9
Weather extremes pose an extreme difficulty for Niagara farmers https://bit.ly/3AWODi3
FALL-LIKE ARCTIC FRONT TO GRIP MUCH OF NORTH AMERICA: SNOW FORECAST FOR MONTANA, WYOMING, UTAH AND COLORADO https://bit.ly/37Ubq1w
Heavy Rain from Fred; Western Monsoon Conditions Continue https://www.weather.gov/
“UNSEASONAL” SNOW BLASTS KASHMIR, SOUTH AFRICA’S FOOD PRICES SOAR DUE TO EXTREME FREEZE, EUROPEAN CROP WOES, + RARE LOW-LEVEL SNOW HITS TASMANIA https://bit.ly/3xZkUmX
Moderate Quake Shakes World’s Largest Volcano https://bit.ly/3AQkK39
Worldwide Volcano News https://bit.ly/3y58XgJ
and more
 

TxGal

Day by day
New Zealand Sees 1+ Meter (3.3 Feet) of Snow in 24 Hours, Summer Flurries Hit Alberta, as "Wildfire Season-Changing" Storms and Record Cold Sweep the U.S. - Electroverse

Mt-Hutt-NZ-Aug-2021-e1629359230575.jpg

Extreme Weather GSM

NEW ZEALAND SEES 1+ METER (3.3 FEET) OF SNOW IN 24 HOURS, SUMMER FLURRIES HIT ALBERTA, AS “WILDFIRE SEASON-CHANGING” STORMS AND RECORD COLD SWEEP THE U.S.
AUGUST 19, 2021 CAP ALLON

The COLD TIMES are returning, the mid-latitudes are REFREEZING, in line with the great conjunction, historically low solar activity, cloud-nucleating Cosmic Rays, and a meridional jet stream flow (among other forcings).

NEW ZEALAND SEES 1+ METER (3.3 FEET) OF SNOW IN 24 HOURS

Heavy snowfall has buried the higher elevations of New Zealand’s South Island this week. Unfortunately though, the substantial dumpings of global warming goodness have coincided with a snap nationwide COVID lockdown –due to ‘one’ case being reported in Auckland!?– meaning folks can’t enjoy the slopes.

Conditions have brought “great snow accumulations around the country,” reports mountainwatch.com.

Ohau reported 1 metre (3.3 feet) at its summit in only a 24 hour period, while other locations around the Southern Alps saw totals around the half a metre mark.

It’s been a mild winter overall in New Zealand, according to data supplied by the National Institute of Water and Atmospheric Research. However, multiple blasts of Antarctic air have still managed to blast the nation in recent months.

New Zealand towns registered their first snowfalls in a decade in June as record-challenging cold tore in:


While the country suffered its first of a string of polar invasions in early July, registering a low of -11.2C (11.8F):


NIWA are claiming both June and July were record warm months across New Zealand. And while that seems hard to believe –given the sheer number of Antarctic blasts– I haven’t delved into the data enough to question it. I will bet that the UHI effect is at play though, as it always is, and with government agencies there’s always the chance of outright data-tampering, too.

But what I won’t let them get away with is there August to October outlook.

According to NIWA, the next three months were supposed to see temperatures hold well-above the average (surprise-surprise).

Well, we’re now approaching the end of August, and its been a very cold month across both islands. The first 3-or-so weeks of the month have seen heavy snowfalls with a similar recurring pattern, continues the mountainwatch.com article: “high-pressure systems off the southeast of Australia have been peeling off into the Tasman, north of the country, while low pressure approaches in the south. This has induced a southwesterly flow, delivering cold fronts up and along the length of the country, most recently with great success.”


Mt Hutt on Tuesday after a fresh dumping buried the slopes.

However, even given the awful start to their prediction, NIWA are sticking to their AGW guns.

They say there is still a 60% chance that Aug-Oct temperatures will come out above average, and are calling these recent and persistent August chills merely “individual cold-weather events”. Well NIWA, these individual events are combining to create one-hell of a cold spell–one which has even brought significant power-outages due to increased heating demand:


And looking ahead, these chilly conditions don’t look set to ease anytime soon,.

As a result, public health experts are concerned that this week’s COVID lockdown may increase the spread of other winter viruses, like RSV, in cold, damp and overcrowded homes, with some calling for the Government to increase subsidies to make heating more affordable for people on low incomes (that is, if the power stays on).

The last time New Zealand was in lockdown, in April 2020, the weather was much warmer than has been forecast for this week, reports stuff.co.nz: Temperatures are expected to dip below freezing in some parts of the country overnight Wednesday, as New Zealand enters its second day of lockdown, continues the article.

Many New Zealand houses are poorly insulated, and with everyone now at home for at least seven days in Auckland and the Coromandel, and three days elsewhere, household heating costs are likely to climb.

“That makes a big difference to the household budget,” said Howden-Chapman, director of He Kainga Oranga/Housing and Health Research Programme.

As a result, many people are likely to resort to heating just one room and having all household members congregating there.

Studies showed damp, crowded indoor locations were hotspots for viruses, added Howden-Chapman--well duh…

SUMMER FLURRIES HIT ALBERTA, CANADA

August in the Northern Hemisphere usually means sunshine and warmth, even in Canada. However, Alberta’s weather can be a bit of a wild card at times, and the province is living up to that this week with Kananaskis experiencing rare summer snow.

Environment Canada issued rainfall warnings for multiple provinces this week, but over the nation’s higher elevations, that rain has been falling as snow — this includes Kananaskis’ Nakiska Ski Area, which, according to calgary.ctvnews.ca, received a healthy blast of settling snow months ahead of the hill’s official opening.

Locals took to social media to express their surprise at Alberta’s K-country August flurries:

View: https://twitter.com/eyewatchyou/status/1427662643171573765


View: https://twitter.com/TiffanyLizee/status/1427687712128217091


The return of precipitation is being welcomed following weeks of wildfire warnings — and that includes south of the border too…

“WILDFIRE SEASON CHANGING” STORMS AND RECORD COLD SWEEP THE U.S.

…moisture is returning to much of the United States this week, quelling those exaggerated fears of a never-ending drought and an AGW apocalypse. And as is the case in Canada, the precipitation is falling as SNOW across the higher elevations.

Montana, Idaho, Washington, Montana, NE Oregon, and Colorado (south of Telluride) have all seen snow over the past 48 hours.

While in the last 24 hours, flurries have even been reported in NE Utah, between Salt Lake City and Vernal.

This moisture is arriving on the back of a powerful Arctic front, and along with heavy mountain snow, this setup is also threatening to deliver record-breaking low temperatures to the Western United States:


With this being August, the snow has been confined to the higher elevations –for now– with heavy rains reported elsewhere.

Asheville, NC, for example, received devastating torrential rains on Wednesday, leading to blocked roads, mudslides on I-40, and even power outages: “People were NOT prepared,” said one Asheville local in a recent comment on Electroverse.

Many locales saw record rainfall through Tuesday night, including in Montana.

Helena and Great Falls appear to have been worst affected cities here, as rain, clouds, and chilly August temperatures continue to work their way across the state.

“This storm will be a wildfire season changer,” writes ktvh.com‘s chief meteorologist Curtis Grevenitz.

“Most if not all of the fires in the state have seen healthy rain along with cold temperatures,” continues Grevenitz.

“Even the Pine Grove fire near Zortman, which grew to 17,000+ acres has been seeing moderate rain for hours.

“This storm extends down into the central Rockies as well, with rain for parts of Wyoming, Idaho, Utah and Colorado. The storm and steady rain will shift into eastern Montana on Thursday, with central and western areas remaining cool.

“Friday will be cool with yet another round of wet weather moving into western Montana later in the day. More rain and thunderstorms will continue Friday night and Saturday.

“The significant rain and cold temperatures over a prolonged period will do wonders for the fires, and help firefighters gain an advantage. Fire season may not over yet, but this was a knockdown blow,” concludes Grevenitz.


GFS 2m Temperature Anomalies (C) Aug 19 – Aug 22 [tropicaltidbits.com].

The COLD TIMES are returning, the mid-latitudes are REFREEZING, in line with the great conjunction, historically low solar activity, cloud-nucleating Cosmic Rays, and a meridional jet stream flow (among other forcings).

Both NOAA and NASA appear to agree, if you read between the lines, with NOAA saying we’re entering a ‘full-blown’ Grand Solar Minimum in the late-2020s, and NASA seeing this upcoming solar cycle (25) as “the weakest of the past 200 years”, with the agency correlating previous solar shutdowns to prolonged periods of global cooling here.

Furthermore, we can’t ignore the slew of new scientific papers stating the immense impact The Beaufort Gyre could have on the Gulf Stream, and therefore the climate overall.


Prepare accordinglylearn the facts, relocate if need be, and grow your own.
 

alpha

Veteran Member
qqdfr6Xhv1j9ZIyJD5a-FijYMIH4OPBFY11a-1LvXhcR6sbD00TqwnJynL5OH9sj0ex0ykK14MS9TH4lWx_2PsdU2Au5D65Pol6c9xWaYTaMQE6lR5TG1ggmf52t7Eik7bKkKtcxTPJ8rqFWLIF2r_50p3eCH8erYNe3Cmq-u9ej3Vnk3A4BStKCG7sGmv4K87AX6-UDb7kPU4YmrlvG-G_urnykWddvInePvfgmIrwc1FxhjLV0C7MDSQDePkd9wBc3WUZco-aIkDbOQ_Bc2SvV3G3Gbnqc0C3YmLOSauiDFWPRoIf2DOtvR3bSk1wohGMBSkLKFSDKFapgRNp9fA.jpg


Ice Age Farmer ✔

U.S. declares first Western reservoir water shortage, triggering cuts

WATER SHORTAGES OUT WEST

From Reuters: Dated 8/17/2021

"Arizona will lose 18% of its annual apportionment, while Nevada will see cuts of 7%. Apportionments to Mexico, which are required under a 1944 treaty, will be cut by 5%.

Separately, 10 Western governors urged President Joe Biden to declare a federal drought disaster in their states, qualifying farmers and ranchers to seek special assistance "beyond what is available through existing emergency programs."

"Historic drought levels threaten to eliminate entire crops, depress yields and harbor extreme levels of pests and disease that add to the cumulative loss," the governors wrote in a letter.

While not a surprise, the cuts in reservoir supplies will mean less water -- and tough allotment decisions -- for agriculture, cities and Native American tribes in the parched region, which is in its 22nd year of drought."

#water

U.S. declares first Western reservoir water shortage, triggering cuts

Reuters

U.S. declares first Western reservoir water shortage, triggering cuts

U.S. officials for the first time on Monday declared an official water shortage for the massive Lake Mead reservoir, triggering supply cuts to parts of the drought-stricken Southwest, as 10 Western governors appealed for federal drought disaster aid.


24.0K viewsedited


qqdfr6Xhv1j9ZIyJD5a-FijYMIH4OPBFY11a-1LvXhcR6sbD00TqwnJynL5OH9sj0ex0ykK14MS9TH4lWx_2PsdU2Au5D65Pol6c9xWaYTaMQE6lR5TG1ggmf52t7Eik7bKkKtcxTPJ8rqFWLIF2r_50p3eCH8erYNe3Cmq-u9ej3Vnk3A4BStKCG7sGmv4K87AX6-UDb7kPU4YmrlvG-G_urnykWddvInePvfgmIrwc1FxhjLV0C7MDSQDePkd9wBc3WUZco-aIkDbOQ_Bc2SvV3G3Gbnqc0C3YmLOSauiDFWPRoIf2DOtvR3bSk1wohGMBSkLKFSDKFapgRNp9fA.jpg

Ice Age Farmer ✔

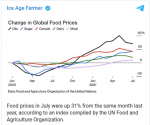
Food prices are exploding, up 31% year-over-year. You can't say Ice Age Farmer didn't warn you!

___
Soaring Cost of Food Is Forcing Families to Scrimp at the Dinner Table

Whether at supermarkets, corner stores, or open-air markets, prices for food have been surging in much of the world, forcing families to make tough decisions about their diets. Meat is often the first to go, ceding space to less expensive proteins such as dairy, eggs, or beans. In some households, a glass of milk has become a luxury reserved only for children; fresh fruit, once deemed a necessity, is now a treat.

Food prices in July were up 31% from the same month last year, according to an index compiled by the United Nations’ Food and Agriculture Organization. A portion of the rise is transitory, fueled by supply chain disruption and extreme weather. Although some of the bottlenecks caused by the pandemic show signs of abating, structural factors such as climate change (indeed, blame the cow farts) and China’s strong appetite for imports will likely endure.

#FoodPrices

Bloomberg - Are you a robot?

Bloomberg

Soaring Cost of Food Is Forcing Families to Scrimp at the Dinner Table

Inflation is slamming fridges shut and leading households around the world to make sacrifices.
 

TxGal

Day by day
Posting this in two parts, here's the first:

The Cover-Up Of Problems In The IPCC Report (by Prof. Antero Ollila) + The IPCC’s Methodology Is Fundamentally Flawed (by Ross McKitrick) (electroverse.net)

ipcc-2-e1629449809172.jpg

Articles

THE COVER-UP OF PROBLEMS IN THE IPCC REPORT (BY PROF. ANTERO OLLILA) + THE IPCC’S METHODOLOGY IS FUNDAMENTALLY FLAWED (BY ROSS MCKITRICK)
AUGUST 20, 2021 CAP ALLON

There is a now a substantial number experts casting serious shade over the “flawed methodology” used by the IPCC in their latest analysis of the climate.

Below is a one-two punch to the IPCC’s Sixth Assessment Report (AR6).


SCIENTIFIC FLAWS IN THE CLIMATE MODELS, AND THE COVER-UP OF PROBLEMS IN THE IPCC AR6 REPORT
[by Antero Ollila, Adj. Prof. Aalto University (Emer.) — below is an abridged version, you can find the original at climatexam.com]

The amount of carbon dioxide in the atmosphere has increased by 32% since 1750. According to the IPCC’s latest climate report (AR6), this is due solely to man-made emissions accumulating by an average of 44% per year, with the rest absorbed by oceans and vegetation.

Approximately 25% of the atmospheric carbon dioxide changes annually from the oceans and vegetation. As a result, less than 6% of the initial amount of carbon dioxide in the atmosphere remains after 10 years, and therefore the increased amount of carbon dioxide in the atmosphere cannot be entirely of anthropogenic origin with a permille value of -28%. The IPCC remains silent on permille values (a measure of the ratio of carbon isotopes used to analyze the origin of carbon dioxide–suitable for validating carbon cycle models).

The cover-up of this issue continues with the anthropogenic carbon dioxide lifetime in the atmosphere, which is now vaguely stated as being from hundreds of years to thousands of years. The removal rate of radioactive carbon from the atmosphere (a perfect tracer test for anthropogenic carbon dioxide) after 1964 is only 64 years. The recovery time of the total atmospheric amount of carbon dioxide to the level of 1750 can be estimated to be similar to that of its accumulation period, i.e. just under 300 years.

Furthermore, the AR6 report no longer shows the IPCC’s own definition of the greenhouse effect, except a brief mention in the glossary. Missing is the explanation for how a greenhouse gas absorption of 158 Wm-2 can create downward infrared radiation on the ground of 342 Wm-2 — this is against fundamental physical laws because it assumes that the excess energy came from nothing.

The radiation to the surface consists of four energy fluxes, which, according to the IPCC’s energy balance, are 1) greenhouse gas absorption of 158 Wm-2, 2) latent water heat 82 Wm-2, 3) sensible heat (warm air): 21 Wm-2, and 4) solar radiation absorption in the atmosphere: 80 Wm-2. The first three energy fluxes total 261 Wm-2 and maintain the greenhouse effect. So, by distorting the size of the greenhouse effect on the absorption of greenhouse gases alone, the IPCC is able to increase the contribution of carbon dioxide in the greenhouse effect from approximately 7.5 % to 19%, and the temperature effect from 2.5 °C to 6.3 °C.

This also means that the equations used by the IPCC to calculate the radiation forcing values and the global warming impacts of carbon dioxide for increasing carbon dioxide concentrations are not in line with the contribution of carbon dioxide in the greenhouse effect.

The IPCC’s science, aka the definition of “climate change” in the Paris Agreement, gives a strongly exaggerated warming capability to carbon dioxide.

Moreover, AR6 shows a strong positive trend in solar shortwave radiation from 9/2000 to 6/2017, but its impact has been omitted in post-2000 warming calculations [for more, see climatexam.com].

THE IPCC’S ATTRIBUTION METHODOLOGY IS FUNDAMENTALLY FLAWED
[by Ross McKitrick — originally posted on judithcurry.com]

One day after the IPCC released the AR6 I published a paper in Climate Dynamics showing that their “Optimal Fingerprinting” methodology on which they have long relied for attributing climate change to greenhouse gases is seriously flawed and its results are unreliable and largely meaningless. Some of the errors would be obvious to anyone trained in regression analysis, and the fact that they went unnoticed for 20 years despite the method being so heavily used does not reflect well on climatology as an empirical discipline.

My paper is a critique of “Checking for model consistency in optimal fingerprinting” by Myles Allen and Simon Tett, which was published in Climate Dynamics in 1999 and to which I refer as AT99. Their attribution methodology was instantly embraced and promoted by the IPCC in the 2001 Third Assessment Report (coincident with their embrace and promotion of the Mann hockey stick). The IPCC promotion continues today: see AR6 Section 3.2.1. It has been used in dozens and possibly hundreds of studies over the years. Wherever you begin in the Optimal Fingerprinting literature (example), all paths lead back to AT99, often via Allen and Stott (2003). So its errors and deficiencies matter acutely.

The abstract of my paper reads as follows:

“Allen and Tett (1999, herein AT99) introduced a Generalized Least Squares (GLS) regression methodology for decomposing patterns of climate change for attribution purposes and proposed the “Residual Consistency Test” (RCT) to check the GLS specification. Their methodology has been widely used and highly influential ever since, in part because subsequent authors have relied upon their claim that their GLS model satisfies the conditions of the Gauss-Markov (GM) Theorem, thereby yielding unbiased and efficient estimators. But AT99 stated the GM Theorem incorrectly, omitting a critical condition altogether, their GLS method cannot satisfy the GM conditions, and their variance estimator is inconsistent by construction. Additionally, they did not formally state the null hypothesis of the RCT nor identify which of the GM conditions it tests, nor did they prove its distribution and critical values, rendering it uninformative as a specification test. The continuing influence of AT99 two decades later means these issues should be corrected. I identify 6 conditions needing to be shown for the AT99 method to be valid.”

The Allen and Tett paper had merit as an attempt to make operational some ideas emerging from an engineering (signal processing) paradigm for the purpose of analyzing climate data. The errors they made come from being experts in one thing but not another, and the review process in both climate journals and IPCC reports is notorious for not involving people with relevant statistical expertise (despite the reliance on statistical methods). If someone trained in econometrics had refereed their paper 20 years ago the problems would have immediately been spotted, the methodology would have been heavily modified or abandoned and a lot of papers since then would probably never have been published (or would have, but with different conclusions—I suspect most would have failed to report “attribution”).

Optimal Fingerprinting

AT99 made a number of contributions. They took note of previous proposals for estimating the greenhouse “signal” in observed climate data and showed that they were equivalent to a statistical technique called Generalized Least Squares (GLS). They then argued that, by construction, their GLS model satisfies the Gauss-Markov (GM) conditions, which according to an important theorem in statistics means it yields unbiased and efficient parameter estimates. (“Unbiased” means the expected value of an estimator equals the true value. “Efficient” means all the available sample information is used, so the estimator has the minimum variance possible.) If an estimator satisfies the GM conditions, it is said to be “BLUE”—the Best (minimum variance) Linear Unbiased Estimator; or the best option out of the entire class of estimators that can be expressed as a linear function of the dependent variable. AT99 claimed that their estimator satisfies the GM conditions and therefore is BLUE, a claim repeated and relied upon subsequently by other authors in the field. They also introduced a “Residual Consistency” (RC) test which they said could be used to assess the validity of the fingerprinting regression model.

Unfortunately these claims are untrue. Their method is not a conventional GLS model. It does not, and cannot, satisfy the GM conditions and in particular it violates an important condition for unbiasedness. And rejection or non-rejection of the RC test tells us nothing about whether the results of an optimal fingerprinting regression are valid.

AT99 and the IPCC

AT99 was heavily promoted in the 2001 IPCC Third Assessment Report (TAR Chapter 12, Box 12.1, Section 12.4.3 and Appendix 12.1) and has been referenced in every IPCC Assessment Report since. TAR Appendix 12.1 was headlined “Optimal Detection is Regression” and began

The detection technique that has been used in most “optimal detection” studies performed to date has several equivalent representations (Hegerl and North, 1997; Zwiers, 1999). It has recently been recognised that it can be cast as a multiple regression problem with respect to generalised least squares (Allen and Tett, 1999; see also Hasselmann, 1993, 1997)

The growing level of confidence regarding attribution of climate change to GHG’s expressed by the IPCC and others over the past two decades rests principally on the many studies that employ the AT99 method, including the RC test. The methodology is still in wide use, albeit with a couple of minor changes that don’t address the flaws identified in my critique. (Total Least Squares or TLS, for instance, introduces new biases and problems which I analyze elsewhere; and regularization methods to obtain a matrix inverse do not fix the underlying theoretical flaws). There have been a small number of attribution papers using other methods, including ones which the TAR mentioned. “Temporal” or time series analyses have their own flaws which I will address separately (put briefly, regressing I(0) temperatures on I(1) forcings creates obvious problems of interpretation).

As with regression methods generally, everything in this discussion centres on the GM Theorem. There are two GM conditions that a regression model needs to satisfy to be BLUE. The first, called homoskedasticity, is that the error variances must be constant across the sample. The second, called conditional independence, is that the expected values of the error terms must be independent of the explanatory variables. If homoskedasticity fails, least squares coefficients will still be unbiased but their variance estimates will be biased. If conditional independence fails, least squares coefficients and their variances will be biased and inconsistent, and the regression model output is unreliable. (“Inconsistent” means the coefficient distribution does not converge on the right answer even as the sample size goes to infinite.)

I teach the GM theorem every year in introductory econometrics. (As an aside, that means I am aware of the ways I have oversimplified the presentation, but you can refer to the paper and its sources for the formal version). It comes up near the beginning of an introductory course in regression analysis. It is not an obscure or advanced concept, it is the foundation of regression modeling techniques. Much of econometrics consists of testing for and remedying violations of the GM conditions.

The AT99 Method

(It is not essential to understand this paragraph, but it helps for what follows.) Optimal Fingerprinting works by regressing observed climate data onto simulated analogues from climate models which are constructed to include or omit specific forcings. The regression coefficients thus provide the basis for causal inference regarding the forcing, and estimation of the magnitude of each factor’s influence. Authors prior to AT99 argued that failure of the homoskedasticity condition might thwart signal detection, so they proposed transforming the observations by premultiplying them by a matrix P which is constructed as the matrix root of the inverse of a “climate noise” matrix C, itself computed using the covariances from preindustrial control runs of climate models. But because C is not of full rank its inverse does not exist, so P can instead be computed using a Moore-Penrose pseudo inverse, selecting a rank which in practice is far smaller than the number of observations in the regression model itself.

The Main Error in AT99

AT99 asserted that the signal detection regression model applying the P matrix weights is homoscedastic by construction, therefore it satisfies the GM conditions, therefore its estimates are unbiased and efficient (BLUE). Even if their model yields homoscedastic errors (which is not guaranteed) their statement is obviously incorrect: they left out the conditional independence assumption. Neither AT99 nor—as far as I have seen—anyone in the climate detection field has ever mentioned the conditional independence assumption nor discussed how to test it nor the consequences should it fail.

And fail it does—routinely in regression modeling; and when it fails the results can be spectacularly wrong, including wrong signs and meaningless magnitudes. But you won’t know that unless you test for specific violations. In the first version of my paper (written in summer 2019) I criticized the AT99 derivation and then ran a suite of AT99-style optimal fingerprinting regressions using 9 different climate models and showed they routinely fail standard conditional independence tests. And when I implemented some standard remedies, the greenhouse gas signal was no longer detectable. I sent that draft to Allen and Tett in late summer 2019 and asked for their comments, which they undertook to provide. But hearing none after several months I submitted it to the Journal of Climate, requesting Allen and Tett be asked to review it. Tett provided a constructive (signed) review, as did two other anonymous reviewers, one of whom was clearly an econometrician (another might have been Allen but it was anonymous so I don’t know). After several rounds the paper was rejected. Although Tett and the econometrician supported publication the other reviewer and the editor did not like my proposed alternative methodology. But none of the reviewers disputed my critique of AT99’s handling of the GM theorem. So I carved that part out and sent it in winter 2021 to Climate Dynamics, which accepted it after 3 rounds of review.

Other Problems

In my paper I list five assumptions which are necessary for the AT99 model to yield BLUE coefficients, not all of which AT99 stated. All 5 fail by construction. I also list 6 conditions that need to be proven for the AT99 method to be valid. In the absence of such proofs there is no basis for claiming the results of the AT99 method are unbiased or consistent, and the results of the AT99 method (including use of the RC test) should not be considered reliable as regards the effect of GHG’s on the climate.

One point I make is that the assumption that an estimator of C provides a valid estimate of the error covariances means the AT99 method cannot be used to test a null hypothesis that greenhouse gases have no effect on the climate. Why not? Because an elementary principle of hypothesis testing is that the distribution of a test statistic under the assumption that the null hypothesis is true cannot be conditional on the null hypothesis being false. The use of a climate model to generate the homoscedasticity weights requires the researcher to assume the weights are a true representation of climate processes and dynamics. The climate model embeds the assumption that greenhouse gases have a significant climate impact. Or, equivalently, that natural processes alone cannot generate a large class of observed events in the climate, whereas greenhouse gases can. It is therefore not possible to use the climate model-generated weights to construct a test of the assumption that natural processes alone could generate the class of observed events in the climate.

Another less-obvious problem is the assumption that use of the Moore-Penrose pseudo inverse has no implications for claiming the result satisfies the GM conditions. But the reduction of rank of the resulting covariance matrix estimator means it is biased and inconsistent and the GM conditions automatically fail. As I explain in the paper, there is a simple and well-known alternative to using P matrix weights—use of White’s (1980) heteroskedasticity-consistent covariance matrix estimator, which has long been known to yield consistent variance estimates. It was already 20 years old and in use everywhere (other than climatology apparently) by the time of AT99, yet they opted instead for a method that is much harder to use and yields biased and inconsistent results.

The RC Test

AT99 claimed that a test statistic formed using the signal detection regression residuals and the C matrix from an independent climate model follows a centered chi-squared distribution, and if such a test score is small relative to the 95% chi-squared critical value, the model is validated. More specifically, the null hypothesis is not rejected.

But what is the null hypothesis? Astonishingly it was never written out mathematically in the paper. All AT99 provided was a vague group of statements about noise patterns, ending with a far-reaching claim that if the test doesn’t reject, “then we have no explicit reason to distrust uncertainty estimates based on our analysis.” As a result, researchers have treated the RC test as encompassing every possible specification error, including ones that have no rational connection to it, erroneously treating non-rejection as comprehensive validation of the signal detection regression model specification.
 

TxGal

Day by day
Continued:

This is incomprehensible to me. If in 1999 someone had submitted a paper to even a low-rank economics journal proposing a specification test in the way that AT99 did, it would have been annihilated at review. They didn’t state the null hypothesis mathematically or list the assumptions necessary to prove its distribution (even asymptotically, let alone exactly), they provided no analysis of its power against alternatives nor did they state any alternative hypotheses in any form so readers have no idea what rejection or non-rejection implies. Specifically, they established no link between the RC test and the GM conditions. I provide in the paper a simple description of a case in which the AT99 model might be biased and inconsistent by construction, yet the RC test would never reject. And supposing that the RC test does reject, which GM condition therefore fails? Nothing in their paper explains that. It’s the only specification test used in the fingerprinting literature and it is utterly meaningless.

The Review Process

When I submitted my paper to CD I asked that Allen and Tett be given a chance to provide a reply which would be reviewed along with it. As far as I know this did not happen, instead my paper was reviewed in isolation. When I was notified of its acceptance in late July I sent them a copy with an offer to delay publication until they had a chance to prepare a response, if they wished to do so. I did not hear back from either of them so I proceeded to edit and approve the proofs. I then wrote them again, offering to delay further if they wanted to produce a reply. This time Tett wrote back with some supportive comments about my earlier paper and he encouraged me just to go ahead and publish my comment. I hope they will provide a response at some point, but in the meantime my critique has passed peer review and is unchallenged.

Guessing at Potential Objections

1. Yes but look at all the papers over the years that have successfully applied the AT99 method and detected a role for GHGs. Answer: the fact that a flawed methodology is used hundreds of times does not make the methodology reliable, it just means a lot of flawed results have been published. And the failure to spot the problems means that the people working in the signal detection/Optimal Fingerprinting literature aren’t well-trained in GLS methods. People have assumed, falsely, that the AT99 method yields “BLUE” – i.e. unbiased and efficient – estimates. Maybe some of the past results were correct. The problem is that the basis on which people said so is invalid, so no one knows.

2. Yes but people have used other methods that also detect a causal role for greenhouse gases. Answer: I know. But in past IPCC reports they have acknowledged those methods are weaker as regards proving causality, and they rely even more explicitly on the assumption that climate models are perfect. And the methods based on time series analysis have not adequately grappled with the problem of mismatched integration orders between forcings and observed temperatures. I have some new coauthored work on this in process.

3. Yes but this is just theoretical nitpicking, and I haven’t proven the previously-published results are false. Answer: What I have proven is that the basis for confidence in them is non-existent. AT99 correctly highlighted the importance of the GM theorem but messed up its application. In other work (which will appear in due course) I have found that common signal detection results, even in recent data sets, don’t survive remedying the failures of the GM conditions. If anyone thinks my arguments are mere nitpicking and believes the AT99 method is fundamentally sound, I have listed the six conditions needing to be proven to support such a claim. Good luck.

I am aware that AT99 was followed by Allen and Stott (2003) which proposed TLS for handling errors-in-variables. This doesn’t alleviate any of the problems I have raised herein. And in a separate paper I argue that TLS over-corrects, imparting an upward bias as well as causing severe inefficiency. I am presenting a paper at this year’s climate econometrics conference discussing these results.

Implications

The AR6 Summary paragraph A.1 upgrades IPCC confidence in attribution to “Unequivocal” and the press release boasts of “major advances in the science of attribution.” In reality, for the past 20 years, the climatology profession has been oblivious to the errors in AT99, and untroubled by the complete absence of specification testing in the subsequent fingerprinting literature. These problems mean there is no basis for treating past attribution results based on the AT99 method as robust or valid. The conclusions might by chance have been correct, or totally inaccurate; but without correcting the methodology and applying standard tests for failures of the GM conditions it is mere conjecture to say more than that.

[by Ross McKitrick — originally posted on judithcurry.com]

See also:


TxGal

Day by day
New from Oppenheimer Ranch Project this morning:

New England Is Facing Its 1st Direct Hurricane Landfall In 30 Years - Tropical Storm Henri Closes In - YouTube

New England Is Facing Its 1st Direct Hurricane Landfall In 30 Years - Tropical Storm Henri Closes In
3,337 views
Premiered 9 hours ago

View: https://youtu.be/ryVQ5ttq6Bo
Run time is 7:05

Synopsis provided:

New England Is Facing Its 1st Direct Hurricane Landfall In 30 Years https://n.pr/3sxjsXS
Hurricane warnings posted for Long Island, southern New England as Henri looks to make landfall Sunday https://cnn.it/3sIsnpy
WINDY MODEL https://bit.ly/3DeV2rd
Key Message For Henri https://bit.ly/3dBiAt0
Experimental Storm Surge Map https://bit.ly/3kawOFM
Total Rainfall Inundation Map
https://bit.ly/3xZM9xK
 

TxGal

Day by day
Another from Oppenheimer:

Update on the eruption in Fagradalsfjall Mountain Iceland - Activity oscillates like heartbeat - YouTube

Update on the eruption in Fagradalsfjall Mountain Iceland - Activity oscillates like heartbeat
1,924 views
Premiered 8 hours ago

View: https://youtu.be/PkcHhgFtCvw
Run time is 3:34

Synopsis provided:

Fagradalsfjall volcano update: Activity oscillates like heartbeat from almost absence to spectacular lava overflows https://bit.ly/3AUcVt2
Update on the eruption in Fagradalsfjall mountain on 19-August-2021 https://bit.ly/3mlVZIe
Feed #2 - Live Iceland Volcano Eruption (8-20-21)
https://bit.ly/3kfhtUa
 

alpha

Veteran Member

TxGal

Day by day
The Oppenheimer Ranch Project has a new podcast out:

August Snow In The Rockies - Henri Barrels Towards New England - Siberian Wildfires - Crestone Fair - YouTube

August Snow In The Rockies - Henri Barrels Towards New England - Siberian Wildfires - Crestone Fair
5,092 views
Premiered 20 hours ago

View: https://youtu.be/Z0oD5YtLca4
Run time is 8:21

Synopsis provided:

Snow in August: Powder forms high in the Uinta Mountains https://bit.ly/383Dxf2
It’s August and it’s snowing in Colorado https://bit.ly/3D4YIvs
“Heavy snow” hits Berthoud, Fall River and Vail Pass Friday morning https://dpo.st/3khxEAF
Summer snow hits Grand County’s mountains https://bit.ly/3B1pbZ6
Season’s first snow reported on Wolf Creek Pass on Thursday https://dpo.st/3B6aeVH
Iowa Predicted To Be In For Rough Winter Season https://bit.ly/3glK9tK
National Hurricane Center https://www.nhc.noaa.gov/
Henri Track https://bit.ly/380cql1
Henri Rainfall Totals https://bit.ly/2Wgemn9
Henri Storm Surge Potential https://bit.ly/3kcyEGb
Wildfire Completely Destroys Yet Another Northern California Town https://bit.ly/3CYQ01E
U.S. Drought Monitor https://droughtmonitor.unl.edu/
Hurricane Warnings In Effect for Parts of Long Island and southern New England https://www.weather.gov/
Worldwide Volcano News https://www.volcanodiscovery.com/volc...
Great Barrier Reef: accept ‘in danger’ status, there’s more to gain than lose https://go.nature.com/3y6jhE2
This Report Could Make or Break the Next 30 Years of U.S. Astronomy https://bit.ly/3y7ejaf
Predicting Solar Storms To Protect Earth https://bit.ly/3k6nBOs
Siberian wildfires double greenhouse gas emission record https://bit.ly/3gjIwMU
Thwaites Glacier: Significant geothermal heat beneath the ice stream https://bit.ly/2XPzBg9
Massive volcanoes could cool Earth more in a warming world https://bit.ly/3j5KTVF
and more
 

TxGal

Day by day
Too soon? Traces of snow observed in Wyoming mountains -- Earth Changes -- Sott.net

Too soon? Traces of snow observed in Wyoming mountains

Greg Hirst
Oil City News
Sat, 21 Aug 2021 09:25 UTC

US 26 near Wind River Lake just east of the Teton, Fremont County line 8/21/21
© WYDOT
US 26 near Wind River Lake just east of the Teton, Fremont County line 8/21/21

Though summer doesn't officially end until next month's autumnal equinox, traces of winter appeared Saturday morning in Wyoming's mountains.

These Wyoming Department of Transportation webcams captured traces of snow on US 26 in the southern Absaroka/northern Wind River Range near Wind River Lake Saturday, at an elevation around 9,609 feet.

Meanwhile, fire managers on the Crater Ridge Fire in the Big Horns reported waking up to snow on the ground and heavy fog Saturday morning.

US 26 near Wind River Lake
© WYDOT
US 26 near Wind River Lake
 

TxGal

Day by day
I would prefer Electroverse would stick to the GSM...this article starts out with Covid. Hopefully this will not be a trend:

"Freedoms Curtailed", Antarctic Front Blasts Argentina with 6.6ft of Snow, + Meteorologists say Autumn has "Already Begun" in parts of Europe (electroverse.net)

snow-argentina-2-e1629708650157.jpg

Articles Extreme Weather GSM

“FREEDOMS CURTAILED”, ANTARCTIC FRONT BLASTS ARGENTINA WITH 6.6FT OF SNOW, + METEOROLOGISTS SAY AUTUMN HAS “ALREADY BEGUN” IN PARTS OF EUROPE
AUGUST 23, 2021 CAP ALLON

The average temperature of planet Earth is cooling, not warming — and if the ‘climate sciences’ hadn’t been so utterly corrupted by the powers that be, this fact would be openly reported on, known by all, and freely discussed.

However, we don’t live in a word with open reporting , knowledge, and free discussion; instead, we exist in a paradigm of fear and control, where global governments –working under the unseen umbrella of global governance— have used the pandemic to enforce new powers, with many now working to make coronavirus laws permanent.

See: the climate lockdowns are coming, “for the good of the planet”.

During the pandemic, a total of 32 countries have used militaries of military ordances to enforce rules.
To monitor rule-breakers, 22 countries have used surveillance drones. Facial recognition programs have been expanded, internet censorship has occurred in 28 countries, and full internet shutdowns in 13.

Also, at least 120 contact-tracing apps are in use across 71 states, and 60 other digital contact-tracing measures have been used across 38 countries.

These statistics were reported by Luke Kemp, research associate at the Center for the Study of Existential Risk at the University of Cambridge, in a recent BBCuture article (an article now which has since been buried/removed by the BBC–unless I’m being blind?).

The global populations’ state of fear was heightened during the pandemic: fear that was 1) orchestrated by the elites, 2) perpetuated by the MSM, and then 3) used as an excuse to usher in new Draconian powers through the back door.


This is a classic tactic used by governments for time-immemorial: during heightened senses of fear and stress –often completely manufactured– new powers can be successfully attained. Pavlov said, if you want to condition people, condition them under stress.

And we the people have sure been put under stress these past two years, and coincidentally our freedoms have been curtailed — we have been conditioned to accept these news measures because “the government is here to help us in times of crisis”–that’s what they’d have us believe, of course; however, the data on that reveals quite a different story…

There is no evidence to support the effectiveness of mass surveillance in combating viruses or terrorists (the latter being the number one excuse for the introduction of new draconian powers prior to COVID), yet surveillance remains the go-to response when “disaster’ strikes.

A recent review of the effectiveness of COVID-19 response measures published in Nature Human Behavior ranked police and army interventions, surveillance and the activation of an activation of an emergency response at the bottom of surveyed measures. But this isn’t surprising — if you haven’t twigged already, emergency powers are used to benefit governments rather than save lives.

As pointed out in that missing Luke Kemp article, one study of disasters and the use of constitutional emergency provisions found that the move powers given to the executive, the higher the body count. And countries with already heavy suppression of media freedom used coronavirus as an opportunity to intensify their censorial efforts.

But this is bottom line, let this sink in–I’ll put it in bold and everything: as one recent study found, 87% of the global population is now living in countries which can be considered “repressed”, “closed,” or “obstructed”.

We should consider this outrageous.

We are living, today, in global totalitarianism.

But very few seem recognize the slippery slope we’re on…

And now back to the bread and butter of what I do at Electroverse — below are some historically COLD weather events that those powers-that-be would rather you didn’t know about:

ANTARCTIC FRONT BLASTS ARGENTINA WITH 6.6FT OF SNOW

A severe winter storm has delivered high winds and blizzards to the higher elevations of Argentina over the weekend. A a result, many regions have been put on “heavy snowfall” alerts, and many more roads and passes have been blocked.

Across the province of Neuquén –most notably in the towns Caviahue, Copahue and Cajón Chico— temperatures plunged to -20C (-4F) with the wind chill driving the mercury even lower.

With regards to the snow, Hugo Volpe, mayor of the region, said: “We have 70cm (2.3ft) in the entire center of Caviahue. It began at night with intermittent snowfalls and increased throughout the day.”

View: https://twitter.com/valecaviahue/status/1429355090515800069

Run time is 0:45

At the height of the storm, “visibility was not good,” continued Volpe.

Vehicles in and around the town reportedly saw their brake systems freeze due to the exceptional cold.

A string of stranded cars soon blocked the roads. Thankfully though, all of the occupants were successfully evacuated.

snow storm in the province: which are the most affected routes?

“On the hill there must be 50cm (1.64ft) snow,” added Volpe.

“In the intermediate zone it must be 75cm (2.46ft), and one meter (3.3ft) at the top.”

Volpe also noted it was impossible to access Copahue, where the snow depth “must be above two meters (6.6ft)”.


The cold is set to further ravage alread decimated crops.

And the story is similar in neighboring Brazil, too.

After enduring the worst drought in nearly a century followed by a prolonged bouts of record-breaking cold temperatures, areas within Brazil’s farming belt are braced for further adversity as the La Niña weather phenomenon threatens to bring more adverse conditions later this year, reports ft.com.

In the small mountain town of Caconde in São Paulo state, third-generation coffee grower Ademar Pereira, 44, estimates that half of this year’s crop will be lost because many of the shrubs on his family’s modest plantation have succumbed to the freeze.

“It was already going to be a very small harvest. And with the frost, it got worse,” he said.

“There are lots of people who’ve lost everything.”

Brazil is an agricultural powerhouse and a leading exporter of commodities including corn, sugar, orange juice and meat, but this year’s weather disruptions have led to soaring prices for coffee and sugar on international markets while giving bullish corn traders further fuel, continues the ft.com article.

“Brazil is such a large exporter, especially of coffee and sugar, whatever happens in the country impacts the markets,” said Kona Haque, analyst at traders ED&F Man. The South American nation is the world’s largest producer and exporter of coffee, and initial estimates of production losses for next year’s crop could be 50 per cent of previous forecasts, pushing up prices.

See also:


METEOROLOGISTS SAY AUTUMN HAS “ALREADY BEGUN” IN PARTS OF EUROPE

We’re still in August, yet autumn has already begun in some areas of Europe, including Latvia, according to meteorologists.

Arctic air masses will continue to invade northern/central Europe this week, reports bnn-news.com, bringing fall-like cold snaps.

This is according to the Latvian State Environment, Geology and Meteorology Center, and is backed-up by the latest GFS runs:

AUG 26:

GFS 2m Temperature Anomalies (C) for Aug 26 [tropicaltidbits.com].

AUG 27:

GFS 2m Temperature Anomalies (C) for Aug 27 [tropicaltidbits.com].

Looking further ahead -admittedly into the unreliable time-frame– things then take a turn for the colder as the calendar flips to September — temperature departures of as much as 12C below the seasonal average are expected across a significant portion of the continent.

SEPT 6:

GFS 2m Temperature Anomalies (C) for Sept 6 [tropicaltidbits.com].

Shortening growing seasons are to be expected during prolonged bouts of low solar activity — and this is exactly what we’ve been seeing over the past few years, and across both hemispheres, too.

Planet Earth is cooling in line with the intensifying Grand Solar Minimum, and in a society where truth is censored and lies aligning with totalitarian agendas are perpetuated, don’t expect your nation’s government to warn you of this impending reality anytime soon — it is not in their best interest to have an informed public. Therefore, you’ll have to rely on your own ability to think critically when information passes in front of you–a skill the masses lack, due in part to the successful ‘dumbing down’ of society via the schooling system.

One of the main fallacies doing the rounds, and one that many even within the critical thinking camp fall for, is that in a time of crisis is it our fellow man that is our biggest threat. But this isn’t the case, and is instead yet another excuse perpetuated by governments in order to justify the implementation of Draconian powers during emergencies.

In reality, we do better on our own, and the data supports this — it has been shown that we peasants simply ‘get on with it’ and successfully form new orders and structures to cope with whatever changing reality the emergency delivers. Yes, some people are dicks, and they will always be dicks; but overall, we humans –though still a primitive bunch– do posses the skills and inclination to work together in a crisis. Again, despite the narrative, the data reveals that in times of trouble we humans actually do far better WITHOUT government intervention than with it–intervention increases that body count. And as a simple example: if a desperate, starving family arrived at your door, it is instinctively within your nature –no matter how much of a stickler you may be– to help in whatever way you can; you would warm them, and feed them — and it is this that is the overriding spirit within all of us, though it is one seldom noted.

And this brings me onto my final point: work hard to get yourself into that better position now so that you will have an abundance to share with others when the ‘real’ SHTF.

Start preparing, today.

Don’t be that family in need.

The COLD TIMES are returning, the mid-latitudes are REFREEZING, in line with the great conjunction, historically low solar activity, cloud-nucleating Cosmic Rays, and a meridional jet stream flow (among other forcings).

Both NOAA and NASA appear to agree, if you read between the lines, with NOAA saying we’re entering a ‘full-blown’ Grand Solar Minimum in the late-2020s, and NASA seeing this upcoming solar cycle (25) as “the weakest of the past 200 years”, with the agency correlating previous solar shutdowns to prolonged periods of global cooling here.

Furthermore, we can’t ignore the slew of new scientific papers stating the immense impact The Beaufort Gyre could have on the Gulf Stream, and therefore the climate overall.


Prepare accordinglylearn the facts, relocate if need be, and grow your own.
 

packyderms_wife

Neither here nor there.
Another from Oppenheimer:

Update on the eruption in Fagradalsfjall Mountain Iceland - Activity oscillates like heartbeat - YouTube

Update on the eruption in Fagradalsfjall Mountain Iceland - Activity oscillates like heartbeat
1,924 views
Premiered 8 hours ago

View: https://youtu.be/PkcHhgFtCvw
Run time is 3:34

Synopsis provided:

Fagradalsfjall volcano update: Activity oscillates like heartbeat from almost absence to spectacular lava overflows https://bit.ly/3AUcVt2
Update on the eruption in Fagradalsfjall mountain on 19-August-2021 https://bit.ly/3mlVZIe
Feed #2 - Live Iceland Volcano Eruption (8-20-21)
https://bit.ly/3kfhtUa

and it seems to be mirroring the quakes in the south Atlantic.
 

Martinhouse

Deceased
Today has been the hottest day so far this summer here at my place in NW central Arkansas. I spent all morning and into early afternoon planting my fall potatoes. (And covering them with a DEEP layer of newly fallen leaves, which are early and plentiful this year, to keep the soil moist and cool). I ran out of shade but will do a little more planting this evening and then hope to finish up tomorrow. All planting is in small containers that I can roll around to move to better spots according to weather, or are planted in bigger containers along the outer fence of my outdoor container garden, so there is something to attach sheets or tarps to should I need to protect the plants from any early frosts.

I have zillions of clothespins and spring clamps and oodles of tarps and old sheets so all I'll need is lots of energy and a good headlamp if we should get a surprise early frost.

If winter comes early this year, I won't get much of a crop for all my efforts, but even if I just replace what I've planted, this would at least give me the assurance of fresher potatoes for the next spring planting.

I am NOT looking forward to winter! I like heat...didn't even change from this morning's sweatshirt into a T-shirt this afternoon.

I HATE WINTER!!!!!
 

TxGal

Day by day
Hey there, Martinhouse! You've been busy :-)

We're hovering around 100 for the next few days...miserable hot out there with the humidity. We're seeing a few signs of fall coming, the wild ducks are gathering into larger flocks and bringing their broods from this spring. They always do that before they fly down to the coast for the winter.

Oddly, I'm not seeing any more honey bees except just a few. There for awhile we had them in high numbers going after the downed fruit from our pear trees thanks to the raccoons. Now, despite there still being some pears on the ground partially eaten, the bees are nowhere to be seen. I'm not quite sure what to make of it.

Potatoes...ugh, I need to get mine into tubs...way behind, I'm working like crazy on reorganizing our pantry room. Given how hot it is, I'm okay with that...for now.

Yep, I hate winter, too!
 

TxGal

Day by day
Adapt 2030 has a new podcast out:

Winding Down of Our Civilization - YouTube

Winding Down of Our Civilization
10,755 views
Aug 23, 2021

View: https://youtu.be/wTHj9IPw1Nc
Run time is 12:52

Synopsis provided:

We are back at store buy limits and bare shelves across so many US retailers and your food supply. Phytophthora fungus if running unchecked across gardens destroying local crops and the yields you need for self sufficiency will require more than two people working in the back yard. Its in play shortages 2.0 get ready.
 

TxGal

Day by day
"Beast" of a Polar Air Mass Engulfs Australia, Another Record-Smashing Cold Front to Blast South Africa, + Earth's Magnetic Field is in for a Bumpy Few Days - Electroverse

blackout-2-e1629802054950.jpg

Articles Crop Loss Extreme Weather GSM

“BEAST” OF A POLAR AIR MASS ENGULFS AUSTRALIA, ANOTHER RECORD-SMASHING COLD FRONT TO BLAST SOUTH AFRICA, + EARTH’S MAGNETIC FIELD IS IN FOR A BUMPY FEW DAYS
AUGUST 24, 2021 CAP ALLON

Things have taken a turn for the chilly across the Southern Hemisphere this week — both Australia and Southern Africa are bracing for record-challenging lows and heavy, high-elevation snows:

“BEAST” OF A POLAR AIR MASS ENGULFS AUSTRALIA

Rain, snow and gale-force winds have broken a bout of unseasonably warm temperatures in Australia’s southeast.
“In Sydney, we’re seeing a peak of 14 degrees (C) today, which is very different than the 27 or 28 recorded over the weekend,” Bureau of Meteorology (BOM) forecaster Hugh McDowell told AAP on Tuesday.

This week’s intense cold front has indeed delivered a stark transition from the warm winter days enjoyed in the New South Wales (NSW) capital of late, and is further evidence of the swing between extremes observed during prolonged bouts of low solar activity–such as the Grand Solar Minimum we appear to be descending into now.

See also:


A severe weather warning is in place Tuesday afternoon as a “rapidly developing beast” of a low formed off the east coast–one which is now delivering high winds, snow, and, in places such as Sydney, a months worth of rain in just 24 hours.

Maximum temperatures are plummeting in the wake of the front, “in parts dropping by up to 12 degrees (C),” said BOM meteorologist Miriam Bradbury, whose agency has advised residents to move vehicles away from trees, secure loose items, and keep at least 8 meters away from powerlines in case they fall.

By Tuesday afternoon, the sudden cold front had brought 40 mm (1.6 inches) of rain across NSW’s east and central coast, heavy snow to the Blue Mountains, and single-digit temperatures to all, reports ecns.cn — and there’s much more where that came from…

BOM meteorologist Melody Sturm told the Sydney Morning Herald that residents should brace for more chilly, inclement weather, with 90 mm (3.5 inches) of rain possible in some areas including the Hunter, Sydney and Illawarra coasts.

“It’s safer indoors right now than outdoors… and not just for the virus,” she said (using the COVID ‘crow-bar’).

The latest GFS run (shown below) appears to back-up Sturm’s sentiments re the lingering chill — it reveals that the intense mass of polar cold currently sweeping the majority of the Australian continent will persist for at least the next few days:


GFS 2m Temperature Anomalies (C) Aug 24 – Aug 26 [tropicaltidbits.com].

The continent-spanning cold will continue delivering substantial volumes of snow to the southeast, too.

The states of New South Wales and Victoria look set to be worst hit.

Snow is also expect to dust the higher elevations of Tasmania over the coming days.


GFS Total Snowfall (cm) Aug 24 – Aug 28 [tropicaltidbits.com].

Rug-up Australia…

ANOTHER RECORD-SMASHING COLD FRONT TO BLAST SOUTH AFRICA

South Africa has been no stranger to violent Antarctic air mass this winter season — it’s already been a record-breaker, and this week, the nation is bracing for yet another round of intense polar shocks.

A colder-than-normal Antarctica (shown below) is releasing a string of violent fronts over Southern Hemisphere landmasses this year — another symptom of the historically low solar activity we’ve been experiencing in recent years (a sleepy sun weakens the jet streams — see “The Changing Jet Stream” article linked above for more).

Forecast Image
[climatereanalyzer.org]

Also note: according to the Climate Change Institute at the University of Maine –the folks responsible for the Climate Reanalyzer graphic above– during this time of supposed ‘catastrophic global heating’, Earth’s average temperature is, as of Tuesday, Aug 24, 2021, running at a ‘terrifying’ 0.0C vs the 1979-2000 base.

Those Climate Lockdowns can’t come soon enough! (sarc)


The South African Weather Service (SAWS) has warned residents of extremely cold temperatures, and also of substantial snowfall over the country’s higher elevations.

On Tuesday morning, weather alerts were issued that are valid for Thursday, Friday and Saturday (although the polar blast now looks set to extend into Monday, according to the latest GFS run–shown below).

“Significant rainfall amounts, very cold conditions with snowfall over the high-lying areas, damaging winds and significant wave heights are expected in places over the Western and Northern Cape from Thursday until Saturday,” read the SAWS alert.

Spokesperson for the Western Cape Local Government James Brent-Styan said: “We urge people to take precautions ahead of the bad weather”.

Looking at the GFS, the warnings are indeed justified.

What the latest run sees for Saturday, Aug 28 is truly astonishing — much of Southern African can expect temperature departures plummeting a staggering 20C (or more) below the winter norms–this includes not only South Africa, but also the nations of Botswana and Namibia to the north.

Such lows threaten to decimate already ravaged crops in the area, they also risk bringing significant disruptions to the wider economy, too, and even a danger to life:


GFS 2m Temperature Anomalies (C) Sat, Aug 28 [tropicaltidbits.com].

Here’s Sunday, Aug 29:


GFS 2m Temperature Anomalies (C) Sun, Aug 29 [tropicaltidbits.com].

Stay tuned for updates…

EARTH’S MAGNETIC FIELD IS IN FOR A BUMPY FEW DAYS

A solar wind stream and, possibly, two Coronal Mass Ejections (CMEs) are approaching Earth.

A direct hit by the stream on Aug 25 followed by near-misses (or glancing blows) from the CMEs on Aug 26 could spark 2 to 3 days of geomagnetic unrest, according to Dr. Tony Philips of spaceweather.com.

This is not a ‘big event’, not by any stretch of the imagination; however, disruptions to radio operators and even to parts of the electrical grid are possible given 1) the events are hitting in a one-two punch, and, more crucially 2) our planet’s ever-waning magnetic field (click the article below for more on that).

Eyes to the skies, and, again, stay tuned for updates


IN OTHER NEWS

Almost half the crop of the UK’s two favorite homegrown apples have been wiped out by the extremely cold spring of 2021.

Cox’s and Bramley have suffered due to prolonged and record-breaking frost in April and early-May.

Staying with apples, the Canadian Horticultural Council provided a preliminary estimate of 18,866,589 bushels for the 2021 season — this is down almost 9% from 2020, and, as is the case in the UK, has been blamed on poor weather.

It’s more than just UK orchards suffering this year.

As reported by thegrocer.co.uk, heavy rain and hail coupled with unseasonably low temperatures have hit harvests and yields across cereal and potato crops, too. In fact, a similar story is being reported across much of Europe.

According to , this spells bad news for feed producers in particular: “After supply chain disruptions and raw material unavailability, now weather-related challenges in Europe will most likely affect this year’s crop quantity and quality. Cold temperatures, heatwaves, tornadoes, and hailstorms are expected to adversely affect the quality and quantity of the harvest.”


The torrential rains in France and Germany, for example, “have darkened Central and Western farmers’ prospects … while the quantity may be there, the quality of wheat and corn is under question.”

Europe’s woes is compounding the misery witnessed across the globe this year: from South America to China, from South Africa to the U.S., crops are being utterly decimated by inclement weather –usually cold related– and our global stores are running dangerously low.

Prepare for the worst grow your own.

And finally, coming out of politico.eu, the European Union’s natural gas reserves are currently well under normal levels — and if they don’t fill up by October, the bloc could face a price squeeze and even shortages if there’s a repeat of last winter’s severe Arctic outbreak.

“Going into the current winter with less in storage, Europe is walking a tightrope — and it wouldn’t take a huge gust of wind to knock us off,” said Jack Sharples, a research fellow at the Oxford Institute for Energy Studies.

“All it would take is for some [liquefied natural gas] projects currently offline to not come back on, or some unplanned maintenance on a pipeline bringing gas into Europe, or just another cold winter,” added Sharples.

The EU’s reserves were full a year ago — this is what allowed the bloc to comfortably weather an unusually long winter that sent global gas prices skyrocketing in January, continues the politico.eu article. Europe “managed to get through last winter relatively unscathed, as we had such high storage stocks at the start,” said James Huckstepp, gas analyst at S&P Global Platts.

Currently, EU storage facilities are filled to only 60 percent capacity, or just under 70 bcm of gas – -that needs to get up to at least 80 bcm by October 1 to ensure a proper buffer against market fluctuations through winter, Sharples said.

However, with LNG imports on the rise in South America and China, among other regions, and with supply-side technical issues and unplanned maintenance in the likes of Australia and Norway, EU storage facilities reaching 80 bcm appears a big ask.

Europe going ‘off-line’ his winter seems an unthinkable eventuality; however, European’s being unable to heat their homes during the coldest months of the year is a realistic possibility — more signs of the times as that Great Reset dawns…

The COLD TIMES are returning, the mid-latitudes are REFREEZING, in line with the great conjunction, historically low solar activity, cloud-nucleating Cosmic Rays, and a meridional jet stream flow (among other forcings).

Both NOAA and NASA appear to agree, if you read between the lines, with NOAA saying we’re entering a ‘full-blown’ Grand Solar Minimum in the late-2020s, and NASA seeing this upcoming solar cycle (25) as “the weakest of the past 200 years”, with the agency correlating previous solar shutdowns to prolonged periods of global cooling here.

Furthermore, we can’t ignore the slew of new scientific papers stating the immense impact The Beaufort Gyre could have on the Gulf Stream, and therefore the climate overall.


Prepare accordinglylearn the facts, relocate if need be, and grow your own.
 

ktrapper

Veteran Member
Here in the Arctic North Slope it has been cooler than normal for the summer time. We have had no mosquito bloom like we normally do. Usually they are so thick that even Caribou can suffocate from them. Not this year. I have seen only a few. The Snow Buntings migrate this far up feeding on the gnats and mosquitoes. I have seen a lot less of them as well. Only the occasional one.

If I remember correctly we had our last snowy day at our place in Montana on June 14th.
My daughter texted me and told me we had a frost this morning. Granted we are at 6400 feet but usually frost is first to second week in Sept. I am guessing that we have probably lost about 3-4 weeks off of a frost free growing season.
 

TxGal

Day by day

SCAM-e1629878511615.jpg

Articles

OPEN LETTER TO THE PRIME MINISTER OF NEW ZEALAND, BY PETER J. MORGAN: “IT IS NO LONGER POSSIBLE FOR ANY CREDIBLE ARGUMENT TO BE MADE THAT ‘THE SCIENCE IS SETTLED'”
AUGUST 25, 2021 CAP ALLON

Below is an Open Letter to the Prime Minister of NEW ZEALAND, the Minister of Climate Change, the Vice Chancellors of NZ’s 8 universities, and John Morgan, the Chief Executive of the National Institute of Water and Atmospheric Research (NIWA).

It is written by Peter J. Morgan B.E. (Mech.), Dip Teaching
Honorary Chairman and Chief Executive Officer, Environomics (NZ) Trust

The letter begins:

Dr Patrick Frank is a vastly experienced physical methods experimental chemist at the SLAC National Accelerator Laboratory, Stanford University. (SLAC is an acronym for the original name of the laboratory, Stanford Linear Accelerator Center.)

Like me, for at least 30 years Dr Frank in his spare time has pursued an interest in the theory of Anthropogenic Global Warming, since morphed to the meaningless euphemism “Climate Change” – the climate, like the weather, changes continually.

In his Op Ed entitled “A Climate of Closet Monsters”, Dr Frank wrote:

“My work involves experiment, measurement, and theory. As in all of science, the struggle in such work is accuracy. How accurate are the measurements? How accurate is the physical description provided by the theory? Knowledge comes only with accuracy.

In 2001 I decided to investigate the claims about CO2 emissions and climate. I simply wanted to know whether the alarm was justified. So, I studied. By 2003, I knew the alarm was not justified.

The reason is this: The entire confidence that human CO2 emissions cause the climate to warm depends upon the accuracy of climate models. Climate models are an expression of the physical theory of climate. They are currently the only source of information that can tell us how the climate might react to human CO2 emissions.

What I discovered is that if the climate models are magnifying lenses, then using them to see the effect of CO2 on the climate is like trying to see atoms using a jeweler’s loupe.

In early September 2019, my study of climate models passed peer review and was published in the Atmospheric Sciences section of Frontiers in Earth Science. It answers the questions: how reliable are the climate models, and; how much credit should we give to their predictions of a hot CO2-driven future? The answers are: they are not reliable, and no credit.”


I now inform you all that on 2 June 2021, Dr Patrick Frank, in compliance with the IPCC’s own Error Reporting protocol, made a notification to the IPCC.

Here is an extract:

“In my journey of six years to publication, through nine journal submissions, 30 reviewers and their 35 reviews, I did not encounter a single climate modeler who understood physical error analysis, or propagation of error, or the meaning of model calibration or of uncertainty, or of the impact of physical error upon predictive reliability, or even of the absolutely central distinction between accuracy and precision.

Climate modelers are evidently incapable of evaluating the reliability of their own models. This finding provides an explanation for the universal recourse to a useless precision metric to purport projection reliability in their published work, rather than accuracy.

I mention these difficulties because, in evaluating the error that I have here drawn formally to your attention, you will need to consult competent experimental physicists, who do understand physical error analysis, rather than climatologists, who do not so understand.

To reiterate: none of the published air temperature projections, neither in the primary peer-reviewed literature, nor in any of the IPCC Assessment Reports, has any scientific meaning or predictive value whatsoever. No rational policy decisions may be taken on the basis of those projections.

All general-circulation models, whatever other uses they may have, are entirely unsuitable for making projections of anthropogenic global warming. They cannot tell us anything at all about how atmospheric temperatures may evolve in the future, nor explain temperature excursions of the past.

GCMs, in themselves, cannot detect, cannot attribute, and cannot project the impact of CO2 emissions on global mean surface temperatures; neither in the present nor into the 21st century.

The uncertainty propagated through simulation time-steps generates altogether too large an uncertainty envelope for the reliable projection of future warming on any timescale. The models cannot say anything about atmospheric temperature.

Global-warming projections of climate models then, are formally demonstrated to be no better than guesswork. Those projections, which provide the entire case for concern about our influence on the climate are, to put it bluntly, utterly unreliable.

They cannot provide any reliable information on whether the climate will warm or cool. For that purpose, you might as well consult the Oracle at Delphi as any or all of the general circulation climate models.”


Surprise, surprise, the IPCC has so far failed to comply with its own Error Reporting protocol and has simply ignored Dr Frank.

Prescribed in the IPCC’s Error Reporting Protocol is a three-month period in which the IPCC must respond and correct any errors that it cannot refute. Therefore, on 3 September 2021, if neither the IPCC nor any of you has been able to provide a valid scientific refutation of the paper that Dr Patrick Frank submitted to the IPCC with his notification of 2 June 2021, the Trust will publicly call upon each and every one of you to be faithful to the long-established convention of science that a paper that cannot be refuted automatically becomes the new “truth”. Should the IPCC not be able to refute Dr Frank’s paper in compliance with the IPCC’s own Error Reporting Protocol, Prime Minister Ardern must immediately withdraw New Zealand from the IPCC and announce that fact to the nation – and indeed the world. Further, Prime Minister Ardern must immediately announce to the nation – and indeed the world – that it has been proven to the IPCC that there is no climate emergency and that as soon as possible all NZ laws and regulations pertaining to “climate change” and “climate emergency” will be repealed.

Dr Frank is no longer alone in notifying the IPCC that its models have very serious errors.

Earlier this month, Viscount Monckton of Brenchley also notified the IPCC, in accordance with its own Error Reporting Protocol, of a very serious fundamental error in climate modellers’ application of a branch of engineering and physics – namely Control Systems Theory – to the computer models used to make the climate projections upon which all of the IPCC’s Assessment Reports rely. You are all aware of this error, as I have sent you several letters on the work of Viscount Monckton and his team, known as the Argonauts. To your discredit, for all intents and purposes you have all ignored those letters.

About a year ago, Viscount Monckton had notified the IPCC of the Argonauts’ findings, but the IPCC had simply ignored him. This time, he has fully complied with the IPCC’s Error Reporting Protocol. The IPCC now has nowhere to hide, and neither do any of you.

As well as Dr Frank and the Argonauts, there are several other eminent scientists who have written papers explaining serious errors in the climate models relied upon by the IPCC. For your information, more on their work will follow. I shall be encouraging the other scientists to follow the Error Reporting Protocol.

It is no longer possible for any credible argument to be made that “the science is settled”.

When is each one of you going to have your Galileo moment, realise that you are on a hiding to nothing, and concede that you have been duped?

It is now to be hoped that each one of you understands just how serious this matter is. Perhaps you might also begin to understand just why the IPCC climate models’ projections of future global mean temperatures have proven to be so wildly inaccurate and have so far cost the world many trillions of dollars, all to zero effect – in other words, trillions of dollars have been wasted. Just imagine what could have been achieved had those trillions of dollars instead been spent on reducing chemical and plastic pollution of the environment, particularly our planet’s oceans, and also on eradicating poverty in Africa by helping to build modern coal-fired power stations to provide reliable electricity.

Sincerely,

Peter J. Morgan B.E. (Mech.), Dip Teaching
Honorary Chairman and Chief Executive Officer, Environomics (NZ) Trust


TxGal

Day by day
Antarctic Sea Ice 'Rebound' Surprises Scientists - MSM Silent - Electroverse

Ice-sheet-Ant-e1629884829604.jpeg

Articles

ANTARCTIC SEA ICE ‘REBOUND’ SURPRISES SCIENTISTS — MSM SILENT
AUGUST 25, 2021 CAP ALLON

Just two years ago, many mainstream media outlets declared that sea ice at the South Pole was melting at an “astonishing” rate.

As recently pointed out by notrickszone.com, German national daily Süddeutsche Zeitung reported in June 2019 that Antarctic sea ice had “shrunk 1.8 million square kilometers”, writing: “the massive disappearance of ice is astonishing”.

And while the reporting was technically factual, it has proven to be yet more AGW-driving obfuscation and cherry-picking rather than well-founded indications of a concerning climatic trend.

And now, in 2021, as the ice sharply rebounds, these same MSM outlets have fallen silent–which is speaking volumes…

MASSIVE SEA ICE REBOUND GOES UNREPORTED

The climate-ambulance chasing MSM have stopped reporting on the state of the ice across the Southern Hemisphere.

And it is clear to see why:


Sea ice at the South Pole has rebounded in 2020 and 2021, to the levels of some 3-decades ago.

Moreover, the trend of the past 40+ years (the satellite era) remains one of significant growth (of approx 1% per decade).

In 2021, Antarctic sea ice is actually tracking well-above the multidecadal average (shown below).

It is the doomsday scenario that has disappeared, not the ice:


[NSIDC]

The NSIDC website is temporarily down, meaning I can’t share with you August 2021’s impressive data.

However, looking at the above graphic for June, that magenta line running around edges of the Antarctic ice sheet is the 1981-2010 median ice edge — clear for all to see is that this year’s extent is riding comfortably above the norm.

The Antarctic rebound of the past two years shows that there are still a host of natural drivers that remain unknown, writes Die kalte Sonne — it appears that oceanic cycles, such ENSO, SAM or the Indian Ocean play major roles on Antarctic sea ice variability, not linearly increasing CO2.

CLASSIC DISINFORMATION TECHNIQUE

“Researchers are in agreement that the decline in Antarctic sea ice from 2016 to 2019 is due to natural causes,” writes Die kalte Sonne. “Obviously this is not a good topic for the Süddeutsche Zeitung, who prefer not to report on the ice recovery.”

Not informing the public about the most recent developments, but instead leaving them with a false impression based on carefully cherry-picked data from two years prior, is a classic disinformation technique that has long been perfected by the activist media.

For more on Antarctica, see:


And for today’s other article, click below:


The COLD TIMES are returning, the mid-latitudes are REFREEZING, in line with the great conjunction, historically low solar activity, cloud-nucleating Cosmic Rays, and a meridional jet stream flow (among other forcings).

Both NOAA and NASA appear to agree, if you read between the lines, with NOAA saying we’re entering a ‘full-blown’ Grand Solar Minimum in the late-2020s, and NASA seeing this upcoming solar cycle (25) as “the weakest of the past 200 years”, with the agency correlating previous solar shutdowns to prolonged periods of global cooling here.

Furthermore, we can’t ignore the slew of new scientific papers stating the immense impact The Beaufort Gyre could have on the Gulf Stream, and therefore the climate overall.


Prepare accordinglylearn the facts, relocate if need be, and grow your own.
 

TxGal

Day by day
"Dangerous" Level 6 Alert issued in South Africa as Antarctic Blast Nears, Australia's "Remarkable" Snowfall Visible from Space, + UK Wind Farm admits 'Safety Breaches' after Worker Froze to Death - Electroverse

snow-ind-farm-e1629970814189.jpg

Extreme Weather GSM

“DANGEROUS” LEVEL 6 ALERT ISSUED IN SOUTH AFRICA AS ANTARCTIC BLAST NEARS, AUSTRALIA’S “REMARKABLE” SNOWFALL VISIBLE FROM SPACE, + UK WIND FARM ADMITS ‘SAFETY BREACHES’ AFTER WORKER FROZE TO DEATH
AUGUST 26, 2021 CAP ALLON

Here’s your daily dose of ‘climatic reality’, unreported by the MSM.

Our planet is COOLING in line with a historic drop in solar activity.

This truth can’t be concealed for much longer…


“DANGEROUS” LEVEL 6 ALERT ISSUED IN SOUTH AFRICA AS ANTARCTIC BLAST NEARS

In preparation for the incoming blast of polar cold, the South African Weather Service (SAWS) has issued a “dangerous” level 6 alert for vast stretches of the country, particularly across the Western Cape.

Heavy rain, blizzard-conditions, and large hail are expected to bring flooding, mudslides, and widespread power outages.

“Good luck to those of you living in the City of Cape Town this week,” reads the opening line of thesouthafrican.com.

“The heavens are set to open,” continues the article, “capping off a bleak and bitter winter season”:


SA’s latest round of Antarctic chills looks set to break additional low temperature records.

Historic cold will blast much of Southern Africa beginning Friday, Aug 27 and running to Monday, Aug 30–the big freeze will engulf Botswana and Namibia, as well as SA, and is forecast to drop temperature some 20C below the winter average.

Saturday, Aug 28 still looks set to be the coldest day:

AUG 28:

GFS 2m Temperature Anomalies (C) Aug 28 [tropicaltidbits.com].

Although Sunday won’t fair much better, as the freeze sweeps eastward:

AUG 29:

GFS 2m Temperature Anomalies (C) Aug 29 [tropicaltidbits.com].

This cold front shouldn’t be taken lightly, and SAWS is doing everything it can to convey the severity of the blast:

“Heavy downpours are likely to lead to flooding of roads, formal and informal settlements which may lead to damage to property/infrastructure and displacement of vulnerable communities. Essential services such as water and electricity may be affected. Prepare for disruption of traffic due to roads being flooded, with increased travel time.”

“Mudslides and rockfalls may also occur in susceptible areas. Be cautious on the roads and avoid crossing rivers and swollen streams where water is above your ankles. If trapped in a vehicle during a flood, abandon it and climb to higher ground. In buildings, move valuables to a safe place above the expected flood level.”


Heavy snow is also expected across the Western Cape.

“The Western Cape is set to become a winter wonderland this week,” reports thesouthafrican.com, “with a wide coverage of snowfall forecast over the next few days.”

View: https://twitter.com/SAWeatherServic/status/1430502924002762761

The SAWS warning continues:

“Significant lowering of local atmospheric freezing levels is anticipated … allowing for disruptive snowfall in some places.”

“The snow may result in the closure of mountain passes and cause traffic disruptions. Small stock farmers are advised to move livestock to shelter at an early stage to mitigate losses.”

AUSTRALIA’S “REMARKABLE” SNOWFALL VISIBLE FROM SPACE

A satellite image has shown the startling impact of New South Wales’ recent Antarctic front.

The image, posted by weatherzone.com.au, showed the heavy snowfalls in the Central West region were visible from space.

The stark white patch near Oberon on Shooters Hill reveal the substantial accumulations.

“Take a good, long look at the image below, because it’s not something you’ll see very often,” wrote Weatherzone’s Anthony Sharwood in a recent article:


Snow on the Oberon Plateau. To the right is the Sydney basin, with clouds offshore. [Himawari-8]

It’s not often you get snow more than a few centimetres deep, continued Sharwood, or snow that lasts on the ground more than a few hours in areas beyond the Snowy Mountains, in the New South Wales’ southern locales.

But that’s what happened over the last couple of days as a significant cold outbreak delivered 30 cm (11.8 inches) of global warming goodness to parts of the Blue Mountains and Central Tablelands–“as clearly evidenced by the old chair-o-meter,” joked Sharwood:


“What’s remarkable is that the snow persisted into Thursday morning as temps warmed across the state,” added Sharwood, who notes the 10:10 am date stamp on the ‘Thu 26 Aug’ satellite image above.

View: https://twitter.com/Australia/status/1430485143584641030
Run time is 0:23

The below ‘loop’ is courtesy of Weatherzone developer Andrew Miskelly.

It illustrates how so much snow accumulated in areas that usually only get a few centimetres, at best, from winter storms:

View: https://twitter.com/andrewmiskelly/status/1430355867627446277
Run time is 0:20

And while the lower-elevations of SE Australia logged rare 30 cm totals, a meter+ (3.3+ft) has been reported in the mountains.

The conditions on the Barrington overnight Wednesday, for example, were described as “blizzard like”, according to scone.com.au, “with the strong winds causing many large trees to fall.”

View: https://youtu.be/awtlbA9RxAQ
Run time is 2:44

UK WIND FARM ADMITS ‘SAFETY BREACHES’ AFTER WORKER FROZE TO DEATH

File this one under ‘the absurdities of the AGW cult’…

In a bid to stave off supposed ‘catastrophic global heating’, wind farms are being hastily erected across the western world. Tragically though, an extreme blast of climatic reality (aka polar cold) back in 2018 took the life of a security guard at one wind farm construction site near New Cumnock, Scotland.

Ronnie Alexander, 74, literally “froze to death,” reports the BBC.

Mr Alexander had been “exposed to extreme weather conditions” for several hours at the Afton wind farm construction site.

Another security guard was also exposed to the heavy snow and cold, though he survived.

The tragedy unfolded on Jan 21, 2018, after The Met Office issued a yellow “be aware” warning for heavy snow–note also that this was a month before the infamous ‘Beast From The East’ which ran from Feb 24, 2018 to Mar 4, 2018, killing 95 people and resulting in damages of £1.2 billion.

Mr Alexander’s family became concerned when he failed to return from a 12-hour shift at the wind farm near New Cumnock.

A search was soon mounted after Mr Alexander’s grandson raised the alarm at about 20:20.

The family were told at 01:00 that Police Scotland’s Mountain Rescue Team had found the security guard about a mile from his cabin.

Mr Alexander was pronounced dead on Jan 22, with the cause confirmed as hypothermia.

This story is returning the news today because at Ayr Sheriff Court, construction firm Northstone (NI) Ltd and security firm Corporate Services Management have admitted failing to provide a reliable source of heating at the site. The companies also failed to provide an adequate system of communication so their staff could contact the emergency services.

Following the court hearing Northstone issued a statement:

“Northstone accepts that on this occasion at Afton Windfarm we did not meet the high health and safety standards that we seek to achieve to protect our employees, customers, clients, subcontractors and communities. We deeply regret that this resulted in the death of Mr Ronald Alexander. Our thoughts and sincerest sympathies remain with his family and friends.”

IN OTHER NEWS…

Frost damage leads to record Brazilian zucchini prices.

The price of Brazilian zucchini soared +63% month-on-month — the highest level since the price series were started in 2014. The increase is largely attributed to supply shortages, caused by the severe freeze in late-July/early-Aug.
Brazil saw some of its coldest weather in documented history in recent weeks, with sub-zero temperatures and record snow persisting for a prolonged period.

The losses in coffee, corn and sugarcane have been well-documented, but the freeze has also impacted fresh vegetables, and extreme frost damage has been reported across the main zucchini producing states of São Paulo, Minas Gerais, Rio de Janeiro, and Parana.

Zucchinis are among the most consumed vegetables, and have the highest economic value and production in Brazil — a loss in production will cause additional shocks to Brazil’s current economic woes, as supermarket shelves run dry…

Based on recent weather outlooks, a continuation of the cold weather is expected to continue.

Source: mintecglobal.com


The COLD TIMES are returning, the mid-latitudes are REFREEZING, in line with the great conjunction, historically low solar activity, cloud-nucleating Cosmic Rays, and a meridional jet stream flow (among other forcings).

Both NOAA and NASA appear to agree, if you read between the lines, with NOAA saying we’re entering a ‘full-blown’ Grand Solar Minimum in the late-2020s, and NASA seeing this upcoming solar cycle (25) as “the weakest of the past 200 years”, with the agency correlating previous solar shutdowns to prolonged periods of global cooling here.

Furthermore, we can’t ignore the slew of new scientific papers stating the immense impact The Beaufort Gyre could have on the Gulf Stream, and therefore the climate overall.


Prepare accordinglylearn the facts, relocate if need be, and grow your own.
 

TxGal

Day by day
The Sun Fires-Off an 'Earthbound' CME - Electroverse

Aug-26-CME-e1630051938137.png

Articles

THE SUN FIRES-OFF AN ‘EARTHBOUND’ CME
AUGUST 27, 2021 CAP ALLON

Sunspot AR2859 erupted on Aug 26, producing a C3-class solar flare.

SOHO coronagraphs detected the accompanying Coronal Mass Ejection (CME):


The storm appears to be on a direct course for Earth, says Dr Tony Phillips (of spaceweather.com).

NOAA analysts are looking at the CME now, no doubt keen to determine its exact arrival time — Dr Phillips’ guess: Monday, August 30.

Over the past few months, Earth’s ever-waning magnetosphere (due to its shifting magnetic poles and the onset of the next GSM) has failed to handle even the most minor of solar events — even ‘non-events’ have posed problems that in years past wouldn’t have gotten a solar physicist out of bed.

Space weather is now the number one threat to our modern tech-driven civilization.

Earth’s magnetic field is weaker than we’ve all realized.

In the year 2000, we knew the field had lost 10 percent of its strength since the 1800s.

Another 5 percent was lost by 2010.

Further accelerations occurred in recent years, 2015 and 2017, but we laymen were not privy to any additional loss data–with guesses on why that might be quickly sending you down a conspiracy rabbit hole.

View: https://youtu.be/rxo6L255Pp0
Run time is 0:09

What we do know, however, is concerning enough — and given the rapid weakening of our planet’s magnetic field (which nobody denies is occurring btw), even Aug 26’s moderate C3-class CME has the potential to cause disruptions on the ground.

We should expect electrical disturbances upon impact, radio blackouts, and even the blowing of a transformer or two–who knows… But one thing is for sure: this is the future we’re all headed into, and there isn’t a single Draconian power-grab that can save us.

A widescale grid-down scenario is all-but guaranteed by 2024 (as the sun ramps-up into solar cycle 25).

Prepare accordingly…


Furthermore, the flaring on Aug 26 wasn’t actually the main attraction–not initially, anyway.

The eruption also caused a massive “solar tsunami.”

Watch the shadowy wave ripple across the sun in this false-color ultraviolet movie from NASA’s Solar Dynamics Observatory:


The expanding circular shadow is a wave of hot plasma and magnetism.

Based on the time it took to reach the next sunspot, halfway around the sun, the tsunami was traveling 110,000 mph.

Solar tsumanis always herald a CME, and this one was no exception.

As stated above, we now patiently await NOAA’s update re the time and date of that CME’s impact…

(There's a twitter post here that won't copy over from the website, please go to the link to see it)

The COLD TIMES are returning, the mid-latitudes are REFREEZING, in line with the great conjunction, historically low solar activity, cloud-nucleating Cosmic Rays, and a meridional jet stream flow (among other forcings).

Both NOAA and NASA appear to agree, if you read between the lines, with NOAA saying we’re entering a ‘full-blown’ Grand Solar Minimum in the late-2020s, and NASA seeing this upcoming solar cycle (25) as “the weakest of the past 200 years”, with the agency correlating previous solar shutdowns to prolonged periods of global cooling here.

Furthermore, we can’t ignore the slew of new scientific papers stating the immense impact The Beaufort Gyre could have on the Gulf Stream, and therefore the climate overall.


Prepare accordinglylearn the facts, relocate if need be, and grow your own.
 

jed turtle

a brother in the Lord
The Sun Fires-Off an 'Earthbound' CME - Electroverse

Aug-26-CME-e1630051938137.png

Articles

THE SUN FIRES-OFF AN ‘EARTHBOUND’ CME
AUGUST 27, 2021 CAP ALLON

Sunspot AR2859 erupted on Aug 26, producing a C3-class solar flare.

SOHO coronagraphs detected the accompanying Coronal Mass Ejection (CME):


The storm appears to be on a direct course for Earth, says Dr Tony Phillips (of spaceweather.com).

NOAA analysts are looking at the CME now, no doubt keen to determine its exact arrival time — Dr Phillips’ guess: Monday, August 30.

Over the past few months, Earth’s ever-waning magnetosphere (due to its shifting magnetic poles and the onset of the next GSM) has failed to handle even the most minor of solar events — even ‘non-events’ have posed problems that in years past wouldn’t have gotten a solar physicist out of bed.

Space weather is now the number one threat to our modern tech-driven civilization.

Earth’s magnetic field is weaker than we’ve all realized.

In the year 2000, we knew the field had lost 10 percent of its strength since the 1800s.

Another 5 percent was lost by 2010.

Further accelerations occurred in recent years, 2015 and 2017, but we laymen were not privy to any additional loss data–with guesses on why that might be quickly sending you down a conspiracy rabbit hole.

View: https://youtu.be/rxo6L255Pp0
Run time is 0:09

What we do know, however, is concerning enough — and given the rapid weakening of our planet’s magnetic field (which nobody denies is occurring btw), even Aug 26’s moderate C3-class CME has the potential to cause disruptions on the ground.

We should expect electrical disturbances upon impact, radio blackouts, and even the blowing of a transformer or two–who knows… But one thing is for sure: this is the future we’re all headed into, and there isn’t a single Draconian power-grab that can save us.

A widescale grid-down scenario is all-but guaranteed by 2024 (as the sun ramps-up into solar cycle 25).

Prepare accordingly…


Furthermore, the flaring on Aug 26 wasn’t actually the main attraction–not initially, anyway.

The eruption also caused a massive “solar tsunami.”

Watch the shadowy wave ripple across the sun in this false-color ultraviolet movie from NASA’s Solar Dynamics Observatory:


The expanding circular shadow is a wave of hot plasma and magnetism.

Based on the time it took to reach the next sunspot, halfway around the sun, the tsunami was traveling 110,000 mph.

Solar tsumanis always herald a CME, and this one was no exception.

As stated above, we now patiently await NOAA’s update re the time and date of that CME’s impact…

(There's a twitter post here that won't copy over from the website, please go to the link to see it)

The COLD TIMES are returning, the mid-latitudes are REFREEZING, in line with the great conjunction, historically low solar activity, cloud-nucleating Cosmic Rays, and a meridional jet stream flow (among other forcings).

Both NOAA and NASA appear to agree, if you read between the lines, with NOAA saying we’re entering a ‘full-blown’ Grand Solar Minimum in the late-2020s, and NASA seeing this upcoming solar cycle (25) as “the weakest of the past 200 years”, with the agency correlating previous solar shutdowns to prolonged periods of global cooling here.

Furthermore, we can’t ignore the slew of new scientific papers stating the immense impact The Beaufort Gyre could have on the Gulf Stream, and therefore the climate overall.


Prepare accordinglylearn the facts, relocate if need be, and grow your own.
Might be time to start keeping track of one’s cravings for popcorn...
I hadn’t had an urge for any for months but chowed down a bowl full just the nite before last. My early warning system for the next quake? Or just a craving for some normalcy bias?
 

TxGal

Day by day
The Oppenheimer Ranch Project has a new podcast out:

Space Weather Incoming May Intensify Hurricane Nora & Ida - Geomagnetic Storms Expected All Weekend! - YouTube

Space Weather Incoming May Intensify Hurricane Nora & Ida - Geomagnetic Storms Expected All Weekend!
3,405 views
Premiered 9 hours ago

View: https://youtu.be/l2m3iyDVnsU
Run time is 08:10

Synopsis provided:

Large solar storms could cripple the world's internet for WEEKS if it damages the massive undersea cable network, study finds But it can also intensify Hurricanes! https://bit.ly/38hBhAQ
Solar Wind http://bit.ly/2zqv7wT
SDO AIA 131 Ang https://sdo.gsfc.nasa.gov/assets/img/...
GOES X-Ray Flux https://bit.ly/2SKPqSV
ISWA Cignet Streamer (CME Impact Model) https://go.nasa.gov/2R8QL1h
GOES Magnetometer https://bit.ly/3BgqrHK
Planetary K=Index http://bit.ly/2keiUaE
Aroura Forecast http://bit.ly/2nO2A1y
3 Day Geomagnetic Forecast https://www.solarham.net/geo_forecast...
National Hurricane Center https://www.nhc.noaa.gov/
HURRICANE IDA KEY MESSAGE http://bit.ly/2kgOpAN
Hurricane Ida Rainfall Potential https://bit.ly/3sRoUFb
WINDY MODEL https://bit.ly/3DmDglH
 

TxGal

Day by day
Sharp Uptick in Arctic Sea Ice: Extent on course to be the Highest in 15 years - Electroverse

Arctic-Ice-e1630059632120.jpg

Articles Extreme Weather GSM

SHARP UPTICK IN ARCTIC SEA ICE: EXTENT ON COURSE TO BE THE HIGHEST IN 15 YEARS
AUGUST 28, 2021 CAP ALLON

Arctic Sea Ice Extent has been holding exceptionally well during the 2021 summer melt season.

Throughout August, higher volumes than usual have survived due to cold conditions and favorable wind patterns.

As a result, Arctic Sea Ice Extent is now the highest in 8 years, and, if this year’s trajectory continues for another week or two (which is expected), 2021 will achieve the ‘healthiest’ extent of the past 15 years (since 2006).

Only 2014, 2013, and 2009 remain in its way–though the gap is narrowing, fast:


2021 Ice Extent is higher than ALL years since 2006 (excluding 2014, 2013, & 2009, which are set to surpassed within the next few weeks) [NSIDC]

Ordinarily, the highest Arctic Sea Ice Extent since 2006 wouldn’t be anything to write home about.

But we don’t live in an ordinary world.

We exist in a orchestrated narrative of ‘catastrophic global warming’ in which linearly rising temperatures are threatening to melt ALL the ice at the poles, flood cities, and wipe entire nations off the map turn. This is an existential threat to humanity, we’re told, daily; one which requires political intervention, higher taxes, and the further curtailing of our freedoms, i.e. ‘climate lockdowns‘.

So yes, in today’s paradigm of phony temperature graphs and incessantly apocalyptic mainstream media publications, Arctic Sea Ice Extent reaching its highest levels since 2006 is something to write home about.

Such an uptick –if we’re to believe ‘the science’– simply shouldn’t be possible: the ice sheet was supposed to have been ice free by the summer of 2008, and then, when that date uneventfully passed, by 2012, and then by 2013, then 2015, then 2016, and now… well, in 12 years time…? (I’m not exactly sure where the current ‘stab in the dark’ has us…)


The Arctic is the poster child for global warming — if it fails to melt, the IPCC hasn’t a leg to stand on, particularly given the fact that the global average temperature has also refused to play ball in recent years (down some 0.7C since 2016):


And all this is without even mentioning perhaps the largest spanner in the works: the goings-on at the South Pole–home to 90% of Earth’s freshwater.

Across the Southern Hemisphere, the ice trend has been one of growth for the past 40+ years (the satellite era):


After a drop-off in 2015-2019, ice at the South Pole has rebounded strongly in 2020 and 2021, to the levels of some 3-decades ago — this reality maintains the trend of significant growth registered since 1979 of approx 1% per decade.

The year really is a doozy, and is proving impossible for the AGW party to explain-away.

In the 42 years of satellite data, Antarctic Sea Ice Extent in 2021 is the fifth highest on record — bested only by the exceptionally strong years of 2015, 2014, 2010, and 2006:


[NSIDC]

The above graph is admittedly a little busy, so here’s an easier way to convey the state of growth…

This year’s Antarctic Sea Ice Extent is tracking well-above EVERY multidecadal average the NSIDC has to offer:


[NSIDC]

If the alarmists insist on bleating “climate change” re Antarctic, that’s all well and good, but they must admit that the change is one of “falling temperatures” and “a stark accumulation of snow and ice”, as that’s what the data reveals is occurring.

But good luck crowbarring that into the AGW theory…

For more on Antarctica, see last week’s article:

And while we’re on the topic of polar ice sheets, here’s the state of Greenland in the summer of 2021:


Also related:


The COLD TIMES are returning, the mid-latitudes are REFREEZING, in line with the great conjunction, historically low solar activity, cloud-nucleating Cosmic Rays, and a meridional jet stream flow (among other forcings).

Both NOAA and NASA appear to agree, if you read between the lines, with NOAA saying we’re entering a ‘full-blown’ Grand Solar Minimum in the late-2020s, and NASA seeing this upcoming solar cycle (25) as “the weakest of the past 200 years”, with the agency correlating previous solar shutdowns to prolonged periods of global cooling here.

Furthermore, we can’t ignore the slew of new scientific papers stating the immense impact The Beaufort Gyre could have on the Gulf Stream, and therefore the climate overall.


Prepare accordinglylearn the facts, relocate if need be, and grow your own.
 

TxGal

Day by day
Yes, tornado counts in Pennsylvania and New Jersey are abnormally high in 2021 -- Earth Changes -- Sott.net

Yes, tornado counts in Pennsylvania and New Jersey are abnormally high in 2021

Anthony R. Wood
The Philadelphia Inquirer
Fri, 27 Aug 2021 11:05 UTC

Storm damage after the tornado hit in Trevose, Pa., on July 29 during a
© TYGER WILLIAMS
Storm damage after the tornado hit in Trevose, Pa., on July 29 during a "rare" tornado outbreak.
The year-to-date annual tornado numbers are running below normal nationally, no thanks to what has been happening in Pennsylvania and New Jersey.

Both states already have well-exceeded their twister averages for an entire year, bumped up by the "rare" supercell outbreak of July 29 that included one with Tornado Alley-like 140 mph winds, and last week's Fred-related twisters, one of which traveled almost nine miles.

So far in 2021, 19 tornadoes have touched down on Pennsylvania soil, three above the 30-year annual normal and eight more than what would be the average total through August, according to the government's Storm Prediction Center.

Typically, only one would have touched down in Jersey by the end of this month; so far, eight have, which is quadruple the annual average. Two others have visited Delaware.


In a comprehensive analysis and summary report posted this week, the National Weather Service Office in Mount Holly said that the July 29 event, which added 10 twisters to the three-state totals, was ignited by the complex interactions of upper-air and surface systems that created an "unusually favorable" environment for powerful thunderstorms.

(Read more here)
 

TxGal

Day by day
Ice Age Now seems to be offline this morning. Don't know if it's being revamped or closed given Robert Felix's recent passing. Others were apparently trying to keep it going, but the last post was 3 Aug.
 

Martinhouse

Deceased
TxGal, it's a shame that we probably won't have the IceAgeNow site any more, but I think a lot of people don't realize how much work there must be to keep a site going with a steady stream of new information. I do give the new guy credit for trying, though. It was a nice attempt, even if he found he wasn't up to it after all.

I haven't seen anything from Ice Age Farmer since July 31. I wonder if Christian had to evacuate because of wildfire or maybe they no longer have a water supply? I sure hope he is okay! I've missed his steady stream of reports.
 

TxGal

Day by day
TxGal, it's a shame that we probably won't have the IceAgeNow site any more, but I think a lot of people don't realize how much work there must be to keep a site going with a steady stream of new information. I do give the new guy credit for trying, though. It was a nice attempt, even if he found he wasn't up to it after all.

I haven't seen anything from Ice Age Farmer since July 31. I wonder if Christian had to evacuate because of wildfire or maybe they no longer have a water supply? I sure hope he is okay! I've missed his steady stream of reports.

It is looking that way about the IceAgeNow site, sadly, but it must be a huge amount of work to keep those going.

Not much from IAF, I agree, I just hope it's the time restraints from a young family and gardening that are keeping him occupied. Adapt 2030 is still drifting more into political topics/alternative currencies, and Oppenheimer is, well, Oppenheimer...I find it harder and harder to listen to him nowadays. He, too, is drifting into other topics, but with Diamond it's his delivery that often puts me off....but that is just me.

I'm still hoping that this is a 'lull' and we'll see more from most as we push more into winter. Time will tell! There are times where I wonder if I should keep posting what little is out there with so much else going on in the country/world. But, for now I'm keeping on keeping on to see what winter will bring in terms of news and postings.
 

TxGal

Day by day
Historic Snowfall Hits South Africa, Rare Snow Blankets Chilean Desert, "Disappointing" Temps Besiege Europe, La Niña Watch Issued, + CME Update - Electroverse

rare-snow-SA-2-e1630318031362.jpg

Extreme Weather GSM

HISTORIC SNOWFALL HITS SOUTH AFRICA, RARE SNOW BLANKETS CHILEAN DESERT, “DISAPPOINTING” TEMPS BESIEGE EUROPE, LA NIÑA WATCH ISSUED, + CME UPDATE
AUGUST 30, 2021 CAP ALLON

HISTORIC SNOWFALL HITS SOUTH AFRICA

The South African Weather Service (SAWS) had issued a Level 4 Warning for the weekend as “disruptive” snow and record cold threatened to sweep the nation’s higher-elevations, including the Drakensberg.

A SAWS statement read: “widespread snowfall is expected on the high-lying areas with disruptive snow in the south-west.”
However, the flakes fell much further afield than forecast — in Hilton, Hillcrest, Dalton and other parts of the province, too.
Even low-lying regions such as Drummond copped a historic blast of wintry showers.

Sleet fell here, for the first time ever!

“There were was huge excitement,” said Drummond resident and SAPeople contributor Carol Malley.

“Very rare indeed,” she added.

IN PICS | Snow transforms KZN into winter wonderland
Rare snow transforms the KNZ into a “winter wonderland” [Murray Staats].

It was snowing in Killarney, for the first time in living memory.

An excited Juandre Vorster (aka The Weather Hooligan) said: “Staff arrived at Killarney before dawn on the morning of Saturday 28 August, to find sections of the infield still blanketed with snow!”

Juandre shared photos from KZN residents which showed areas covered in snow for the first time in recorded history:

View: https://www.facebook.com/weatherhooligan/posts/124512239914751

Temperatures plunged upon the arrival of the intense polar front.

In response, residents cranked up their electricity usage–but with this being South Africa, a high volume of electricity faults were soon reported across KZN.

Utility company Eskom issued a statement, saying it would endeavor to restore power “as quickly as possible”.

However, unplanned power interruptions continued into Sunday, Aug 29 keeping large swathes of the region in the dark and without heat as the record cold and historic snow persisted.

View: https://twitter.com/ReenvalSA/status/1431574577851863042

View: https://twitter.com/wernertruter/status/1431840881473114113

Substantial flurries were reported in other parts of the country, too — particularly in the Eastern Cape:

View: https://twitter.com/ReenvalSA/status/1431571270202761216

Another cold front is forecast to roll through Mon, Aug 30, though, thankfully, it is expected to be weaker.


RARE SNOWFALL BLANKETS CHILEAN DESERT

A rare dumping of late-season snow has surprised the residents of El Salvador, a small town located in the Chilean desert of Atacama.

Such substantial accumulations are rare for late August, explains local local meteorologist Daniel Diaz.

Even in June or July this event would be considered relatively uncommon, occurring once every 3-or-so years; but heavy settling snow as the month of September looms (aka spring in the southern hemisphere) is “unusual,” says Diaz.

View: https://youtu.be/atj0rhLnrl0
Run time is 0:59

Looking ahead, much of the South American continent should brace for additional waves of late-season cold:

SEPT 9:

GFS 2m Temp Anomalies (C) Sept 9 [tropicaltidbits.com].

SEPT 10:

GFS 2m Temp Anomalies (C) Sept 9 [tropicaltidbits.com].

These September freezes will impact already devastated crops in the continent’s key growing regions, Brazil and Argentina:


“DISAPPOINTING” TEMPS BESIEGE EUROPE

Across Europe, “disappointing” temperatures are setting in as a miserable summer draws to a close, reports BBC Weather.

Cool weather is setting in across central Europe now, said BBC Weather’s Chris Fawkes, “and temperatures are disappointing for August, with only 18 degrees Celsius (64.4F) in Berlin and 16 degrees Celsius (60.8F) in Copenhagen.”

This cool-down is actually forecast to intensify as the week progresses.

By Thursday, much of central and eastern Europe, as well as the Iberian Peninsula, will begin copping fall-like temperatures:

SEPT 2:

GFS 2m Temp Anomalies (C) Sept 2 [tropicaltidbits.com].

By the weekend, eastern Europe is set to suffer temperature departures some 16C below the summer norms:

SEPT 5:
gfs_T2ma_eu_27.png

GFS 2m Temp Anomalies (C) Sept 5 [tropicaltidbits.com].

And if we follow that mass of polar chills eastwards, we see that a large portion of transcontinental Russia will also be affected:


GFS 2m Temp Anomalies (C) Sept 5 [tropicaltidbits.com].

As will Kazakhstan, by Sept 11:


GFS 2m Temp Anomalies (C) Sept 11 [tropicaltidbits.com].

The summer growing season has been cut short, just at the intensification of a Grand Solar Minimum foretells…

LA NIÑA WATCH ISSUED

The Climate Prediction Center has issued a La Niña watch for November 2021 through March 2022.

Since 1950, the National Oceanic and Atmospheric Administration (NOAA) has used sea surface temperatures to categorize the amount of temperature that deviates from the average.

NOAA uses Niño 3.4, a region of sea-surface temperatures (SST) in the central equatorial area of the Pacific Ocean, as the standard for classifying El Niño (warmer-than-normal SST) and La Niña (cooler-than-normal SST) events.

These above- or below-average SSTs have a profound impact on the climate via the upper-level winds.

Basically, La Niña produces a more significant amount of ‘upwelling’ and acts as a gigantic air conditioner for the Earth.

A strong La Niña event arriving in line with the historic drop in solar activity we’ve witnessing of late will only intensify the global cool-down documented since 2016–with Earth’s average temperature down some 0.7C since then:


For a more detailed look at this coming La Niña, see below:


CME UPDATE

Two Coronal Mass Ejections (CMEs) are about to hit Earth.

The first, hurled toward us by last Thursday’s solar tsumani (C3), is expected to arrive on Aug 30.

The second, ejected by Saturday’s solar flare (M4.7–shown below), could impact on Aug 31-Sept 1.


Neither CME is particularly bright or powerful, says Dr. Tony Phillips of spaceweather.com; however, the two arriving in quick succession AND in conjunction with Earth’s ever-waning magnetic field could see us in for a bumpy few days.

Stay tuned for updates…


The COLD TIMES are returning, the mid-latitudes are REFREEZING, in line with the great conjunction, historically low solar activity, cloud-nucleating Cosmic Rays, and a meridional jet stream flow (among other forcings).

Both NOAA and NASA appear to agree, if you read between the lines, with NOAA saying we’re entering a ‘full-blown’ Grand Solar Minimum in the late-2020s, and NASA seeing this upcoming solar cycle (25) as “the weakest of the past 200 years”, with the agency correlating previous solar shutdowns to prolonged periods of global cooling here.

Furthermore, we can’t ignore the slew of new scientific papers stating the immense impact The Beaufort Gyre could have on the Gulf Stream, and therefore the climate overall.


Prepare accordinglylearn the facts, relocate if need be, and grow your own.
 
Top