Part 2
SO WHAT DID THE CDC ACTUALLY DO?
The Epoch Times obtained 3 weeks of safety signal analyses from the CDC for VAERS data updated on July 15, 22 and 29, 2022. Here I will focus on the last one, since there is very little difference between them and it is more complete. The safety signal analysis compares adverse events
1 reported to VAERS for mRNA COVID-19 vaccines from Dec. 14, 2020 through July 29, 2022 to reports for all non-COVID vaccines from Jan 1, 2009 through July 29, 2022.
PRRs are calculated separately for 5-11 year-olds, 12-15 year-olds and 18+ separately. For each age group, there are separate tables for AEs from all reports, AEs from reports marked serious and AEs from reports not marked as serious.
2 Recall that a
serious report is one that involves death, a life-threatening event, new or prolonged hospitalization, disability or permanent damage, or a congenital anomaly. I will focus on the reports for all AE’s.
They also have a table that calculates PRRs by comparing reports for the Pfizer COVID-19 vaccine to reports for the Moderna vaccine and vice versa, again for all reports, serious reports only and non-serious reports. There were no remarkable findings in those tables, so I will not discuss them. [Edit: I forgot what
Norman Fenton noted in his analysis: the overall proportion of reports with serious adverse events is 9.6% for Modern compared to 12.6% for Pfizer.] This isn’t that surprising since both vaccines are very similar and so should present relatively similar adverse events when compared to each other, and any differences are likely not large enough to be picked up by a PRR analysis. [Though the difference in the overall rate of serious adverse events, which are not specific to a particular type of event only how serious it is, was significant.]
The CDC seems to have calculated PRRs for every different type of adverse event reported for all the COVID vaccines examined - though it’s possible they only analyzed a subset. What seems clear is that, among the AEs they examined, the only ones included in the tables satisfy at least one of two conditions: a PRR value of at least 2 and a Chi-square value of at least 4 (Chi is the Greek letter χ and is pronounced like ‘kai’). When both conditions were met, they highlighted the adverse event in yellow, which appears to indicate a safety signal. There were no COVID vaccine AEs listed with fewer than 3 reported events, though for non-COVID vaccines there were many AEs listed that had only 1 or 2 reported since 2009. The CDC tables still include these and highlight them in yellow when the PRR is greater than 2 and the Chi-square value is great than 4, indicating these events are counted as safety signals.
WHAT SAFETY SIGNALS DID THE CDC FIND?
I’m going to divide this up by age groups and the Pfizer v. Moderna comparison. Let’s start with the 18+ group.
There are 772 AEs that appear on the list. Of these, 770 are marked in yellow and have PRR and Chi-square values that qualify them as safety signals. Some of these are new COVID-19 related codes, and we would expect those to trigger a signal since they didn’t exist in prior years to be reported by other vaccines. So if we take those off, we are left with
758 different types of non-COVID adverse events that showed safety signals.
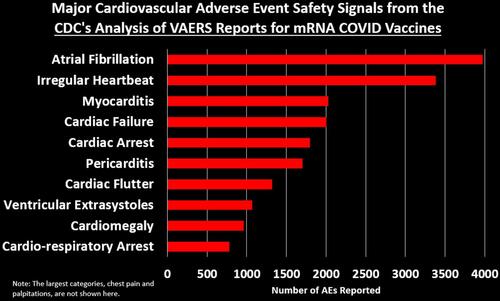
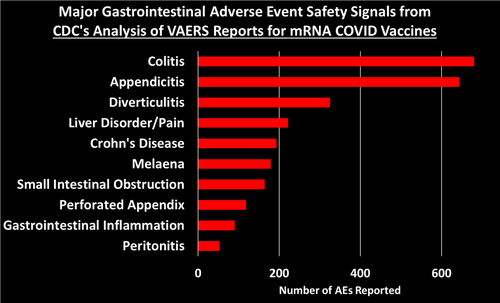
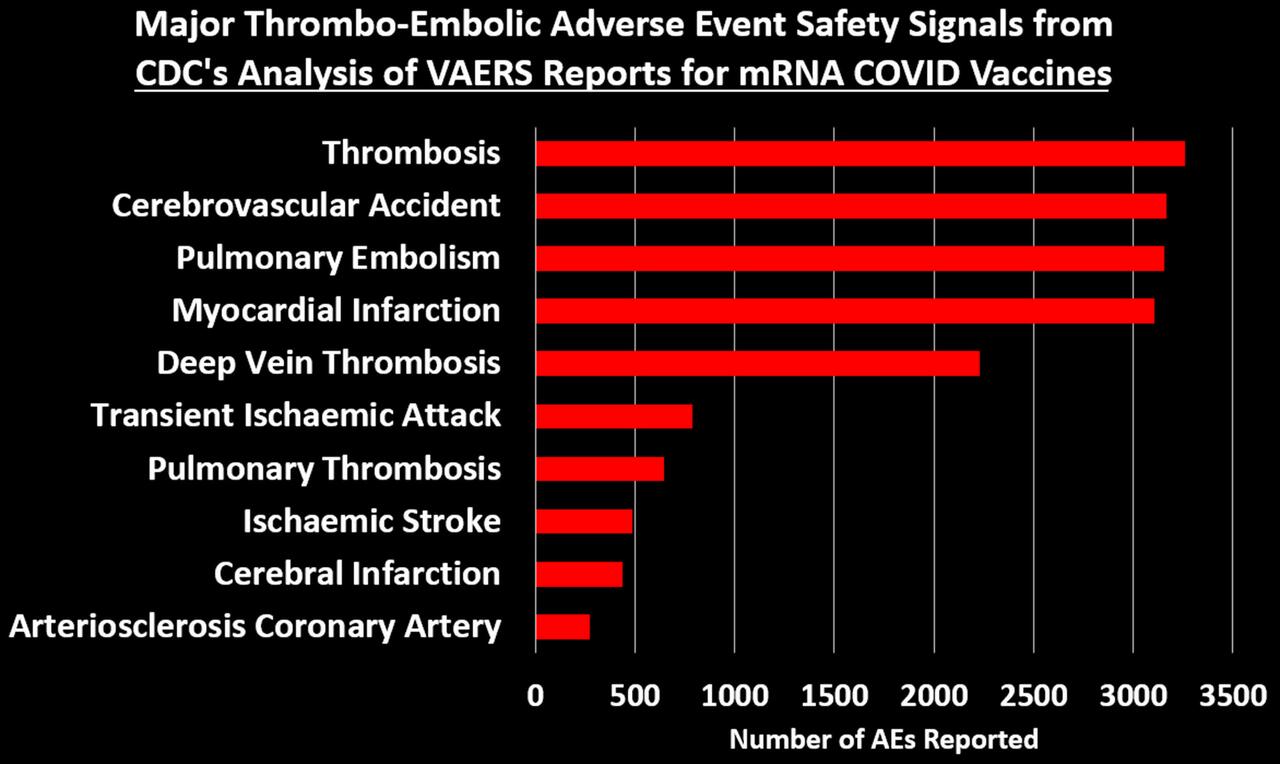
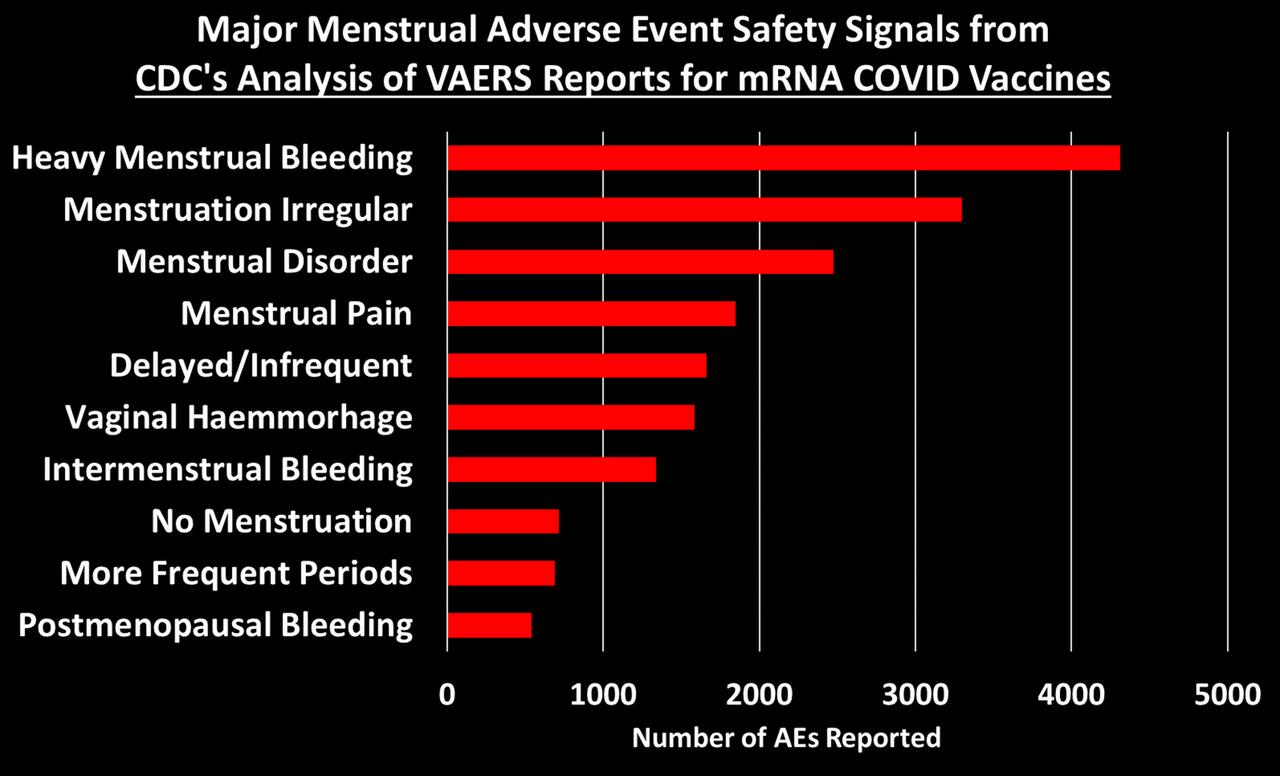
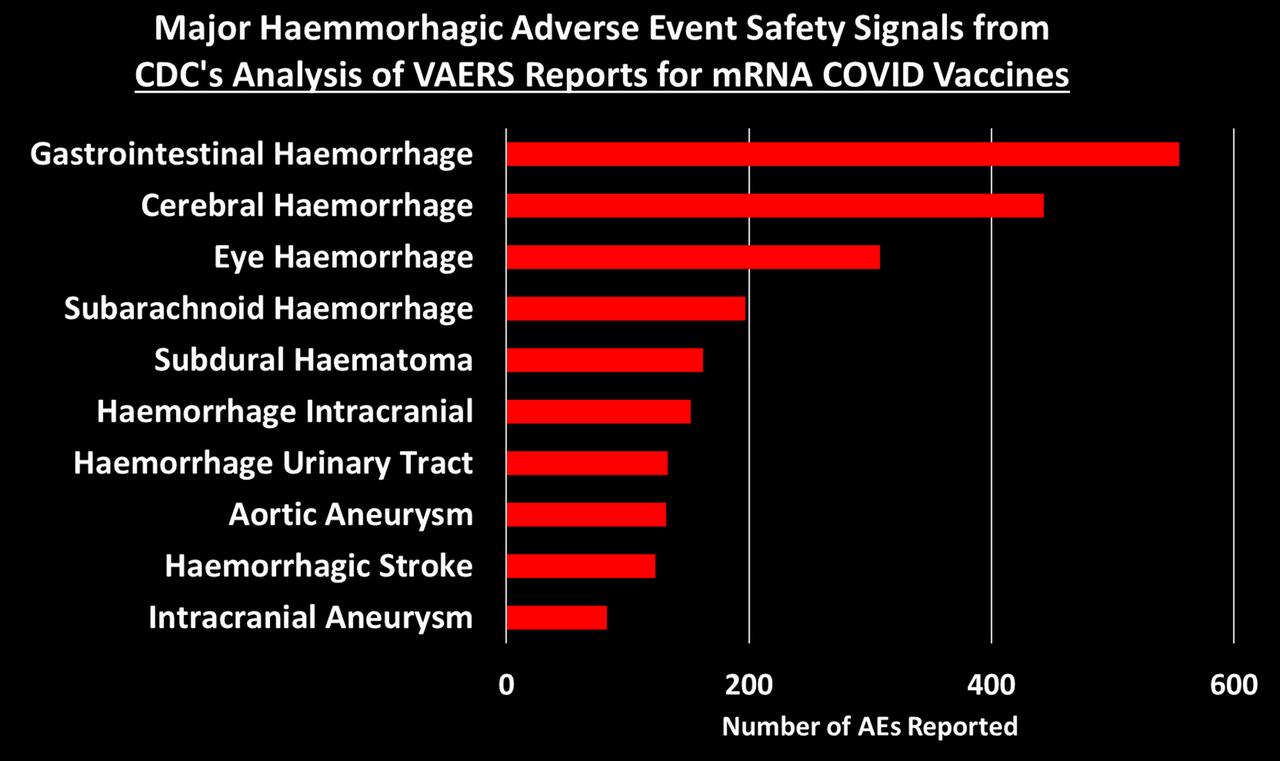
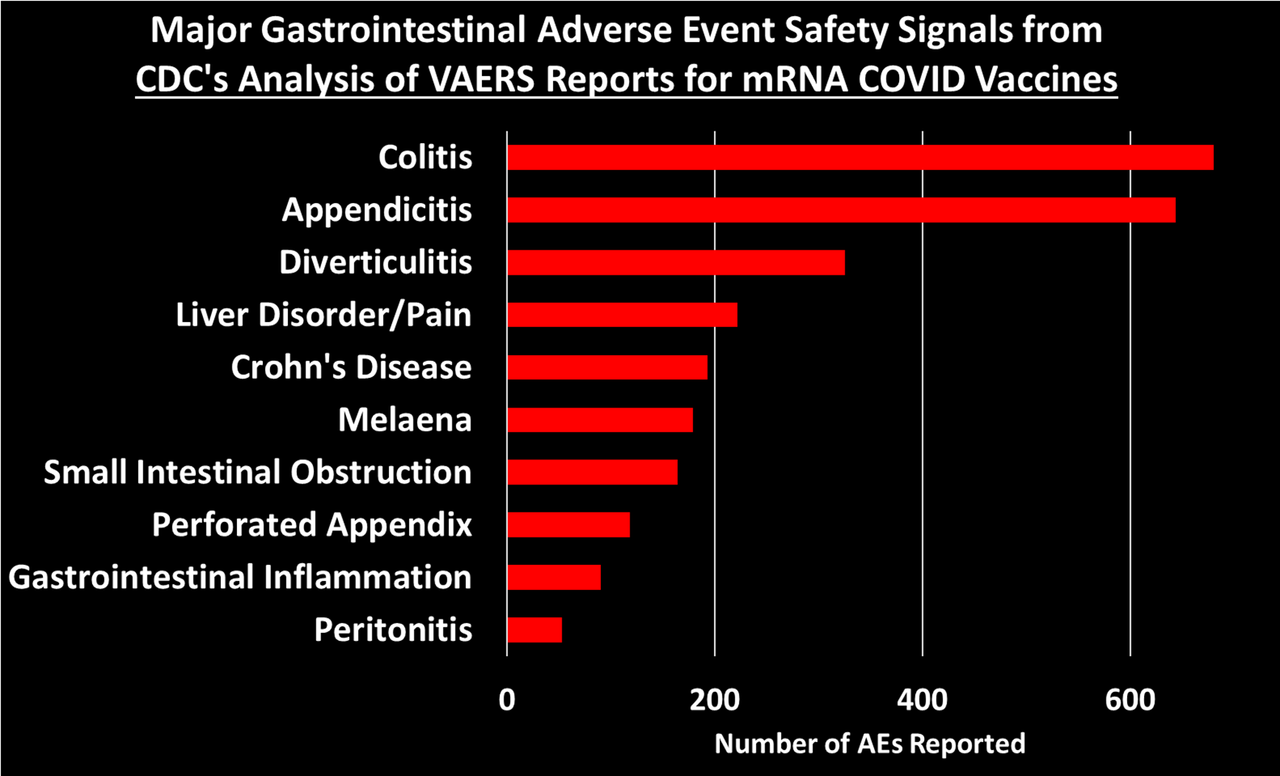
I grouped these 758 safety signals into different categories. The figure below shows the total number of AEs reported for each of the major categories of safety signals:
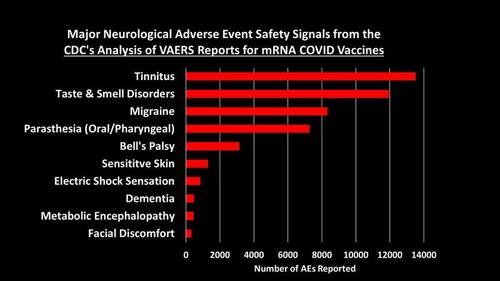
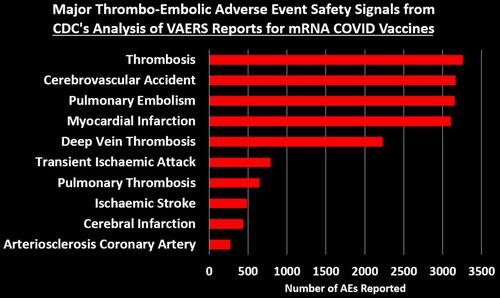
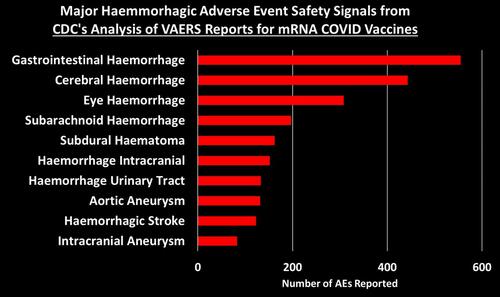
Let’s dig into some of these categories to look at what types of AEs generated the most number of reports:
3

You can peruse the adverse events using the Excel tables provided by the CDC, which were posted by The Epoch Times and Children’s Health Defense at the links at the top of this post.
What about The Children?
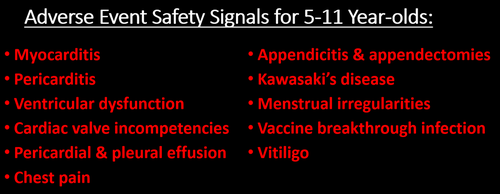
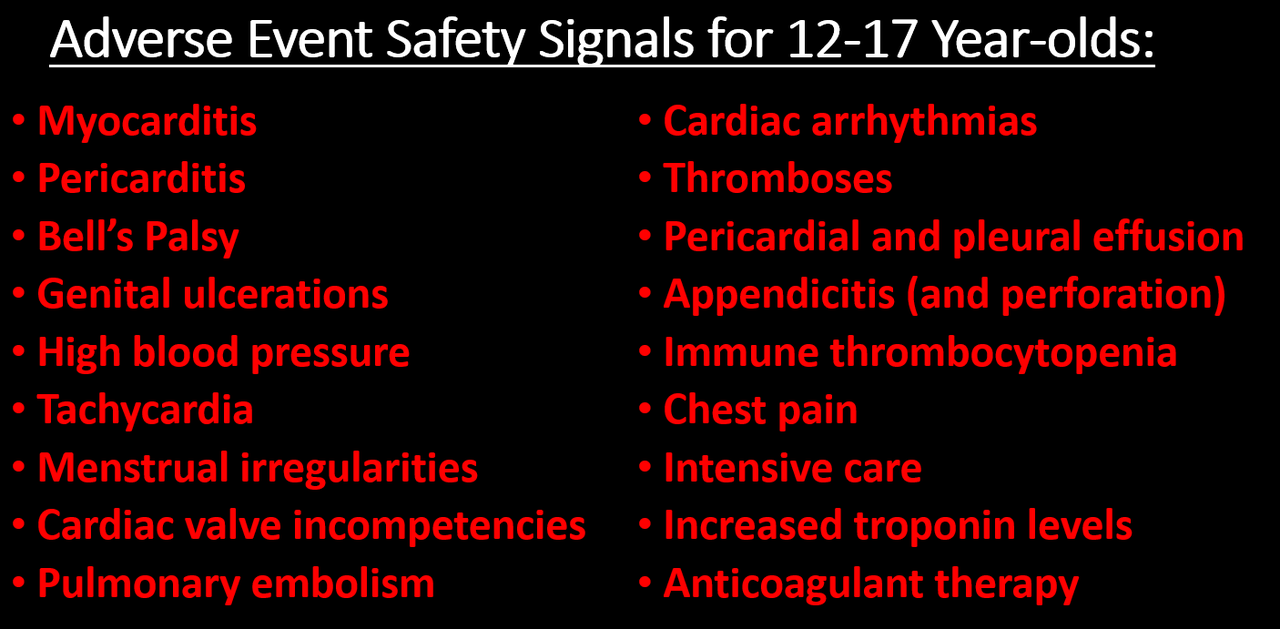
If there is anything that looks remotely like a bright spot in all of this is that the list of safety signals for 12-17 and 5-11 year-olds is much shorter than for 18+. There are 96 AEs that qualify as a safety signal for the 12-17 group and 67 for the 5-11. When we take out the new COVID-era AEs,
there are 92 safety signals for 12-17 year-olds and 65 for 5-11 year-olds. Here are the most alarming ones:

I don’t know why the list of AE’s is so much shorter for these age groups. It could be that the list of AE’s for other vaccines for these age groups is much shorter, so in a case where AEs have been reported for the mRNA COVID vaccines but not for other vaccines, it will not be counted as a safety signal by definition.
COMPARISONS TO MYOCARDITIS & PERICARDITIS
We are told that the existence of a safety signal doesn’t necessarily mean the AE is caused by the vaccine, and I accept that premise. But the current practice seems to be to ignore safety signals, dismiss them as noise without any evidence, and stall any investigation into them as long as possible. The precautionary principle, however, dictates we should presume that a safety signal indicates causality, until proven otherwise. Since, it has been acknowledged that the mRNA COVID vaccines can cause myocarditis and pericarditis (often referred to as myo-pericarditis), we can take those AEs as a kind of benchmark, and propose that,
at minimum, any AE with a signal of equal or greater size should be considered potentially causal and investigated more thoroughly.
4
After dropping the new COVID-era AEs, there are 503 AEs with PRRs larger than myocarditis (PRR=3.09) and 552 with PRRs larger than pericarditis (PRR=2.82).
5 This means that 66.4% of the AEs had a bigger safety signal than myocarditis and 77.3% were larger than pericarditis. You can see what those were by use
this Excel file provided by the CDC and sorting the 18+ tab by the 12/14-07/29 PRR column (Column E). Then just look at which AEs have PRRs larger than the ones for pericarditis and myocarditis.
For 12-17 year-olds, there is 1 safety signal larger than myocarditis (it’s ‘troponin increased’) and 14 safety signals larger than pericarditis (excluding myocarditis), which include: mitral valve incompetence, bell’s palsy, heavy menstrual bleeding, genital ulceration, vaccine breakthrough infection, and a range of indicators of cardiac abnormalities.
For 5-11 year-olds, the comparison to myo/pericarditis is less germane, as they seem to suffer less from this side effect. But we can still make the comparison: there are 7 safety signals larger than pericarditis, including bell’s palsy, left ventricular dysfunction, mitral valve incompetence, and ‘drug ineffective’ (presumably meaning they still got COVID). There are 16 safety signals larger than myocarditis (excluding pericarditis), which in addition to those listed above also include: pericardial effusion, diastolic blood pressure increase, tricuspid valve incompetence, and vitiligo. Sinus tachycardia (high heart rate), appendicitis, and menstrual disorder come in just below myocarditis.
Now if we think of a safety signal as having both strength and clarity, then the PRR can be thought of as an indicator of how strong the signal is, while the Chi-square is a measure of how clear or unambiguous the signal is, because it gives us a sense of how likely the signal is due to chance alone: the larger the Chi-square value, the less likely the signal is due to chance. A Chi-square of 4 means there is only a 5% chance the observed signal is due to chance. A Chi-square of 8 means there is only a 0.5% chance of it being due to chance.
6
For the 18+ group, there are 57 AEs with a Chi-square larger than myocarditis (Chi-square=303.8) and 68 with a Chi-square larger than pericarditis (Chi-square=229.5). Again, you can see what these are by going the Excel file linked above and sorting on Column D.
For the 12-17 group, there are 4 AEs with a larger Chi-square than myocarditis (Chi-square=681.5) and 6 larger than pericarditis (Chi-square=175.4).
For the 5-11 group, there are 22 AEs with a Chi-square larger than myocarditis (Chi-square=30.42) and 34 AEs with a Chi-square larger than pericarditis (Chi-square=18.86).
RESPONDING TO OBJECTIONS
Let’s dispense with some of the criticisms used to dismiss VAERS data, which will undoubtedly be raised if you try to bring the CDC’s analysis to people’s attention.
- Objection: Anybody can report to VAERS. The reports are unreliable. Anti-vaxxers made lots of fraudulent reports. Nobody was aware of VAERS in the past, but now they are. So many people were afraid of the vaccine so they blamed all their health problems on it. Health workers were required by law to report certain adverse events, like deaths and anaphylaxis. Etc. Etc.
All of these objections ultimately rely on the notion that VAERS reports for COVID-19 vaccines have been artificially inflated over previous years for one reason or another. The thing of it is, though, that the CDC has a method for distinguishing between artificial inflation and real signal. The idea is simple: if adverse events are artificially inflated, they should be artificially inflated to the same degree. Meaning, the PRRs for all of these safety signals should be about the same. But even a casual glance at the PRRs in the Excel file show they vary widely, from as low at 2 to as high as 105 for vaccine breakthrough infection or 74 for cerebral thrombosis. This method does not on the number of reports, but the rate of reporting for certain events out of all events reported. If anything, this method would tend to hide safety signals in a situation where a new vaccine generates a very large number of reports.
The CDC has even done us the favor of calculating upper and lower confidence intervals, meaning that we can be at least 95% confident that two PRRs are truly different if their confidence intervals don’t overlap. So for example the lower confidence interval for pulmonary thrombosis is 19.7, which is higher than the upper confidence interval for 543 other signals. Artificially inflated reporting cannot explain why so many different adverse events have large PRRs that are statistically distinct from one another.
- Objection: The safety signals are due to the huge number of COVID vaccines given out. Never before have we given out so many vaccine doses. By the end of July, the US had administered something like 600 million vaccine doses to people aged 18+. But the CDC analysis compares VAERS reports for these doses to all doses for all other vaccines for this age group since Jan. 1, 2009. But from 2015-2020 there were over 100 million flu doses administered annually to this age group alone. In previous work, I estimated 538 million doses of flu given to people 18+ from July 2015-June 2020. The number of flu and other non-COVID vaccines for this age group administered from Jan 1., 2009 through July 29, 2022 must be well over double this number, meaning VAERS reports for COVID vaccines are being compared to reports for at least double the number of doses for other vaccines. In addition to this, as already noted, the PRR methodology does not depend, strictly speaking, on the number of doses, but rather the rate of reporting of a specific AE out of all AEs for that vaccine.
- Objection: the vaccines are mainly being given to older people who tend to have health problems, whereas other vaccines are given to younger people. This objection is dealt with, since the analyses are stratified by age groups. It might be still be somewhat valid for the 18+ group, except that in the safety signal analysis I did in the fall of 2021, I stratified by smaller age bands and still found safety signals. In any case, this objection is not enough to dismiss the safety signal analysis out of hand, but rather calls for better and more refined research.
- Objection: The VAERS data is not verified and cannot be trusted. I’ll be the first person to agree that VAERS is not high quality data, but if it is completely untrustworthy, then how is it that the CDC uses these data to publish in the best medical journals such as JAMA and The Lancet? If the data were worthless, then these journals shouldn’t accept these papers. In that JAMA paper, they reported that 80% of the myocarditis reports met their definition of myocarditis and were included in the analysis. Many other reports simply needed more details for validation. Furthermore, the CDC has the ability and budget to follow-up on every report VAERS receives to get more details and even medical records to verify the report.
So if myocarditis shows a clear signal in the CDC’s analysis, and 80% of those reports were apparently high quality enough to be included in a paper published in one of the world’s top medical journals, how is it possible that all the rest of the reports are junk? That all of the other safety signals are meaningless? Answer: it isn’t.
And since we’re on the topic of safety signals that turned out to be real, it’s instructive to find appendicitis turn up as a safety signal in all 3 age groups, since a study published in NEJM based on medical records of over a million adult Israelis found an increased risk of appendicitis in the 42 days following Pfizer vaccination (but not following a positive SARS-CoV-2 PCR test). That study also found an increase in lymphadenopathy (swollen lymph nodes) after vaccination, but not after positive COVID test. Lymphadenopathy was another safety signal.
- And that brings us to our last objection to be dispensed with: all of these AEs were due to COVID. There was an epidemic and so people were falling ill due to COVID and having all of these problems that were then blamed on the vaccine. Well to begin with, as we just saw, at least two of them (appendicitis and lymphadenopathy) do not appear to have increased risk ratios following a positive SARS-CoV-2 test, and we know that the mRNA vaccines increase risk of myo/pericarditis independent of infections. So how can we assume the rest of these are and dismiss them with the wave of a hand? We can’t. At minimum, they need further investigation. Furthermore, in the safety signal analysis I did in 2021, I dropped all VAERS reports where any sign of a SARS-CoV-2 exposure or infection was indicated on the report, and I still found large, significant safety signals.
End of Part 2
Cont' below part 3


 www.ncbi.nlm.nih.gov


 Do the members of Foreigner know about this???
 apnews.com


 www.zerohedge.com