…… Math/Stats Wizards! Who can answer a question about Standard Deviations?

Kris Gandillon

The Other Curmudgeon
_______________
I recently inherited a new Team at work which was really just a one-man army until they brought me in to support the one-man army as his Lead Technical Program Manager. Now we are hiring additional resources and are up to seven folks.

I have been analyzing the project-related data from the work accomplished by the one-man army over the last two years.

I have been tasked by our VP with adding Standard Deviation to the report that I have developed to show what has been accomplished over the last 2.5 years and what we can accomplish with our new resources once they come up to speed.

I have not had to do Standard Deviation stuff since Statistics class back in college in the late 70’s. Never was called on to use it in 48 years of my IT career…until now. I feel like I have forgotten what little I ever knew about it!

To refresh my memory, I have read various things on the Internet about what it is and does but want to make sure I am properly interpreting what I think it says.

I have the data extracted to Microsoft Excel and I am using its Std Dev function and it gives me what looks like a reasonable answer. Std Dev is used in conjunction with the Average / Mean which I also have and what the report was originally providing.

There are 305 rows of data regarding projects since January 2020. The relevant numbers are the number of Months from beginning to end it took to complete each project. This number varies greatly depending on project complexity and delays due to dependencies on 3rd parties to do some of the work.

According to Excel my Average/Mean is 10 months and my Standard Deviation is 7.5 months.

My Range of values is from .1 month to 25.1 months.

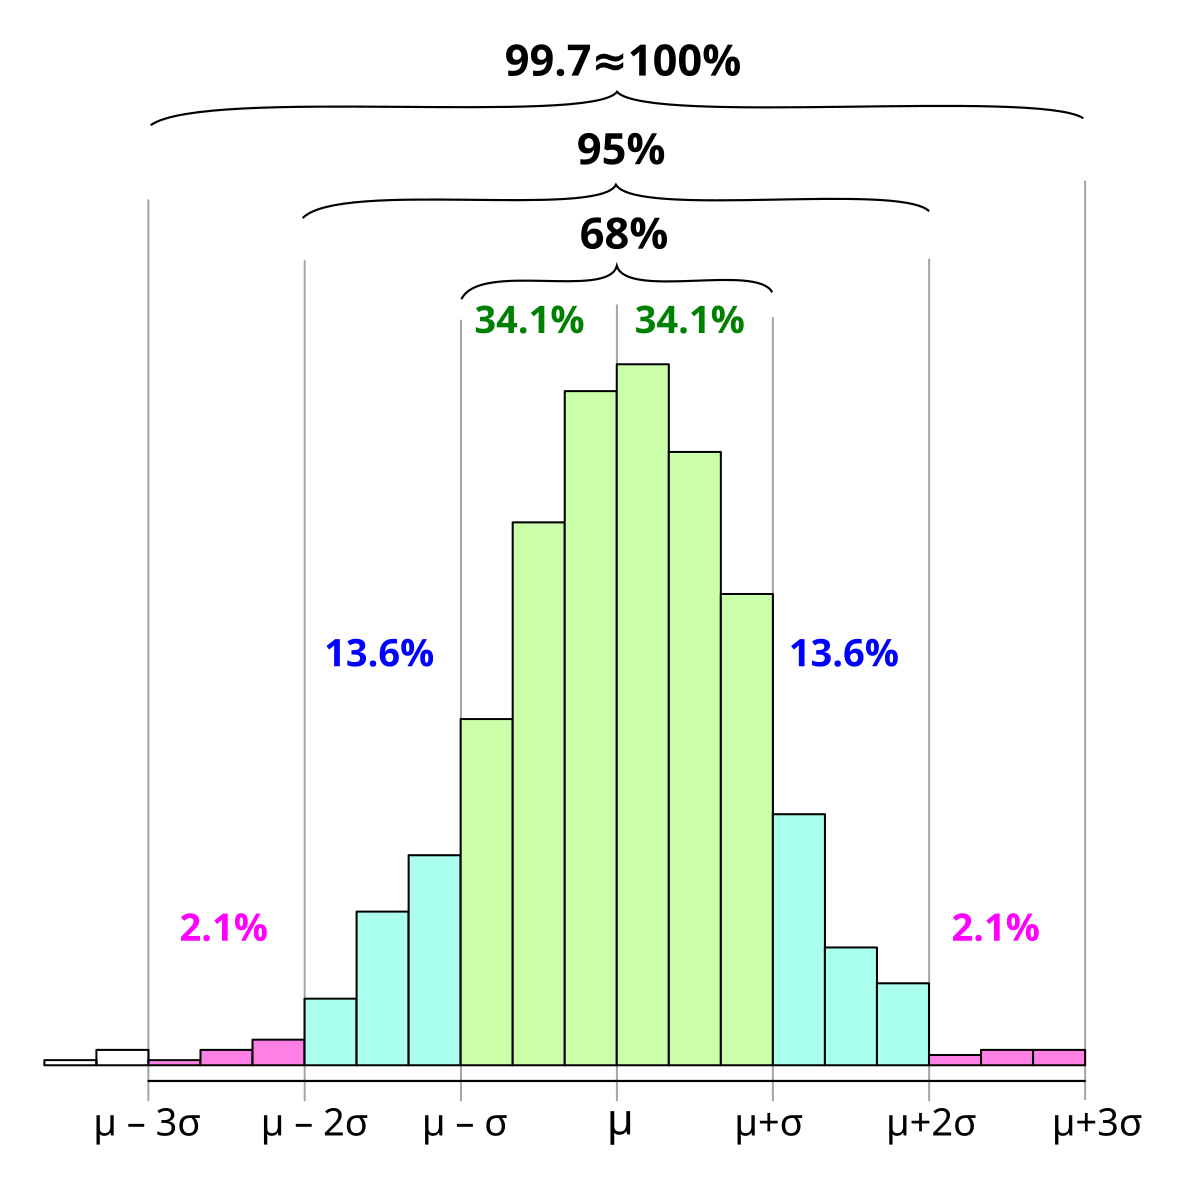
So based on the 68-95-99.7 rule for 1, 2 and 3 standard deviations, does this mean that 68% (1 standard deviation) of my values fall in the range of 10-7.5 = 2.5 months to 10+7.5 = 17.5 months?

That “feels” about right but math is not about “feels”, I am looking for the actual explanation so I don’t get shot down by someone who actually knows and can explain these numbers correctly.

Goal is to get beyond just telling our “customers” (other internal departments) “it takes an average of 10 months for us to complete projects” to a more accurate and defendable data driven statement that says “depending on a few variables, we typically deliver most projects in 2.5 to 17.5 months”. That sets more realistic expectations up front and immediately opens the door to the discussion regarding which variables cause it to be shorter or longer than the “10 month average” the Team had been quoting.

So is my usage of standard deviation above correct?

Thanks for any feedback!
 

AVEL

Member
Thank you for accepting any reply. I have no clue what this project stuff is about but the individual projects might differ so much the standard statistics aren't applicable. You asked.
 

bw

Fringe Ranger
Thank you for accepting any reply. I have no clue what this project stuff is about but the individual projects might differ so much the standard statistics aren't applicable. You asked.
Agree. The idea of giving the standard deviation of project completions suggests a higher management that doesn't have a clue about the real world. Just my take on it. If someone asked me for the standard deviation of my project durations, I'd be looking for another job.

My first IT job with Georgia Pacific was like that. If my test resulted in an ABEND, I'd be explaining it to my manager next day. (I intentionally caused ABENDs so I could get core dumps. This was NOT considered good practice.)
 

mzkitty

I give up.
I hate when they start doing that sh*t. Then you get more dumped on you with less to work with, and the whole company goes to hell because you can't possibly account for every possible deviation or what it means to you in advance. Or something like that. Damn "efficiency experts."

:)
 

Dux

Veteran Member
Future projects (IMHO) should be based on your estimates of the scope of work. I doubt the standard deviation figures woule be useful for 'splaining your project lengths.

Here's the std dev equation: sqr root (((Sum of (x-mean)sqrt)/sample size)), where x is a data point.
 

tnphil

Don't screw with an engineer
In my experience, project work and completions are just not very subject to statistical analysis like "standard deviations", which are generally intended for more random data. There are just too many biasing variables with projects: manpower, budget, management stupidity, ignoring good advice from engineers or others who are paid for experience/knowledge who provide caveats, etc. Time taken to fix stuff that they wouldn't give enough time to do right the first time.

This looks like metrics and micromanagement.

I know my comments don't help Kris with his question, they're just comments.
 

BassMan

Veteran Member
I am NOT a math-wiz, but I would ask the VP if he is thinking standard-deviation from a statistical perspective, or if he is thinking 6-sigma.
 

night driver

ESFP adrift in INTJ sea
BW, how do you debug a program WITHOUT a core dump?? Now note I did a LOT more analysis than coding, but when one of "my" systems (usually inherited) blew up, I was on the 3 AM call sheet and expected to at least show my bright and grumbly face as we figured out how it detonated.
 

night driver

ESFP adrift in INTJ sea
Kris, the more I think about it, I begin to wonder what use the numbers you shared would be to a manager. Real World relevance seems to have taken a flier here.
 
  • Like
Reactions: bw

tnphil

Don't screw with an engineer
Kris, the more I think about it, I begin to wonder what use the numbers you shared would be to a manager. Real World relevance seems to have taken a flier here.
ND, that's kinda what I was talking about. Statistics missapplied are useless.
Metrics. Fancy pie charts to show off at the good-ole-boy retreats at best, or management meetings. These f'ing MBA types in management love to bluster and show graphs, then show their performance made "better" graphs.
 

night driver

ESFP adrift in INTJ sea
SOME of us MBA Types were rooted and grounded in REAL WORLD crap. It's what comes of doing the work in an engineering school environment.
 

tnphil

Don't screw with an engineer
SOME of us MBA Types were rooted and grounded in REAL WORLD crap. It's what comes of doing the work in an engineering school environment.
Obviously, I'm  not talking about all MBA Types. There are good folks with MBA. But: just as there are clueless folks with EE degrees, with whom I'm working and providing solutions and advice (I'm not "degreed" but just got promoted again, finally), there are a bunch of MBA out there who can't find their ass with both hands.

And you know the old saying about lies, damn lies and statistics.
 
Last edited:

Hammer

Veteran Member
Yes you are applying it correctly. There is a68% chance that a project will fall within 1 STDDEV of the mean.
 

bw

Fringe Ranger
BW, how do you debug a program WITHOUT a core dump??
I don't know how they expected us to do it. Core dumps are pure truth; the rest is anecdotes and lies. We had no mechanism to trigger a dump in the language we were using (ADPAC, the closest thing to leprosy in programming), so I'd add a digit to a letter and blow that puppy. (The compiler let me do that without complaint, because it was as crappy as the language.) The IT manager got a demerit if there were more than some threshold number of ABENDs in testing (swear to God). This was in '74.
 

Kris Gandillon

The Other Curmudgeon
_______________
Thanks for all the spot-on comments, I couldn’t agree more with most of them.

Backstory is previous SVP “departed” or was”departed”.

My VP under the departed SVP, was a great guy but decided to make a lateral move back under another SVP we had both previously worked under.

Enter the new SVP and new VP. Brought in from other parts of the company.

They know very little about what we do and we’re very unique and very successful. Our success is now becoming our downfall. Demand has skyrocketed for our services across the company. We had 59 requests in 2020, 101 in 2021 and 147 nine months into 2022 at this point with 449 more requests (that we know about) coming in by the end of 2022 all of which are targeted for completion in 2023.

The VP is trying to get his arms around what we do and how we do it and what our delivery challenges are. So he was looking at our project delivery (completions) report and our Backlog Aging Report.

It mainly shows Intake-Delivery-Backlog raw counts by month over the last 3 years. And Duration from date requested to date delivered in the case of completions and creation date to “today” for the AGE of requests in the Backlog.

So thats when he wanted to see the standard deviation for DURATIONS of completed projects and AGE of Backlog Requests.

The service we provide is simple on the surface but can get quite complex under the covers. We are dealing with 1,400 different products and services that might need to use what we provide. Because of our success, each of those 1,400 products and services are now mandated to reach out to us under certain circumstances.

Each circumstance is effectively a one-off custom implementation of what we provide. Always “similar, but somewhat different”.

Hence the wide range of Durations from a few days for the super simple stuff to multiple years for the super complex stuff.

We’re not doing airplanes but an analogy would be think the equivalent of servicing a Piper Cub on the simple end of things and servicing the Space Shuttle on the complex end. And every kind of flying machine in between also needs service along the way.

Hence the VP’s request to see what the standard deviation looks like for the 300+ project historical data we have from the last 3 years. So there *is* a bit of a method to his madness.

He hopes that 300+ is a large enough sample size to use “the future will likely resemble the past” argument.

We will then apply the Duration metrics found in the historical 300+ projects to the 600+ requests currently in the Backlog. Assuming we model those 600+ Backlog projects to have the same Duration distribution then the Std Deviation of our modeled data should match the Std Deviation of our historical data.

Then we can estimate the length of the Backlog in months/years based on current staffing levels and what it might look like at different increases in staffing levels.

We know TPTB are not going to be happy with that initial timeline to complete those 600 Backlog requests at current staffing level. And, oh yea, the Backlog has also been organically growing at the rate of 10 new requests per month during 2022.

Then it is up to the VP and SVP to go to bat to increase staffing for us to shorten that timeline.

But I caution them that it will take 9-18 months for a new hire from outside the company to come up to speed while if we can “cannibalize” experienced resources from other departments, they can be seriously productive in 3 months.

So far, they have NOT allowed us to hire from within but when they see how bad our modeled timeline will likely look, I think they may have no other real choice. Our circumstances involve solving mandated, regulatory requirements that must be fulfilled.

Again, thanks all who replied. A couple gave the answer / confirmation I was seeking.
 

Quiet Man

Nothing unreal exists
Last edited:

Uhhmmm...

Veteran Member
Hi Kris,

What does this mean? It means that your average project length is about 10 months, but the actual time you will spend on any one project is incredibly dependent upon project complexity. Fully two thirds of your projects are completed in roughly 2 to 17 months.

Look at those numbers.

That is a huge difference. Even more confounding... 1 out of 3 projects will take either less than about two months or more than almost a year and a half!

Given the wide variability in time-to-complete, and the rapidly expanding number of projects you will need to complete, you must quickly determine how to best expend your limited resources. You need to do three things, if you have not already done so:

  1. Identify less than a dozen or so inherent factors which you may use to accurately estimate the complexity of each project.
  2. Develop an extrapolation technique based upon project complexity to estimate the required effort and time to complete each project.
  3. Ask each project submitter to document each project’s ultimate cost-saving or revenue enhancement in terms of dollars. You may have to assist them with this estimate depending upon the technical skills of your users. Please note, though, that sometimes this estimate will be no more than an educated best guess.

With these three factors, you may calculate, as best you may, each project’s return on investment (the famous ROI) and maximize said ROI by spending your time and efforts on the most beneficial projects first. That is, you want to prioritize work on shorter-term projects that return the largest benefit to your company. Of course, you may work on longer-term projects, but longer-term projects require a concomitant increase in returned benefit to justify their higher priority.

BTW, this approach also provides a carefully documented reason for delaying a project start-up should you need to justify your decision. Of course, you should also be aware that this approach must provide some flexibility in order to accommodate projects of an immediate, regulatory, or legal nature.

These are just my first thoughts on the extraordinary set of circumstances confronting you. If you already have such a procedure in mind or in practice, please forgive my impertinence.

Your Friend,
Uhhmmm.
 
Last edited:

Barry Natchitoches

Has No Life - Lives on TB
I am a retired teacher of statistics and quantitative research methods. I am sorry I have not been on the net tonight until now, to find your inquiry.

Also, I have to get up in a few hours to take my wife to her chemo, so I do not have time to read all the responses already provided to you. Maybe I can do that sometime tomorrow.

But to answer your question in the OP, to fully understand the nature of any distribution (list) of numbers, you really do need both the mean and the standard deviation to be provided.

The mean (often times just refered to as the “average”) tells your reader what the typical score tends to be in that distribution.

That is very useful information, of course, but it does not tell you anything about how much spread (variation) there might have been In your distribution.

Were most of the scores clustered around that mean?

Or were the scores scattered all over the place?

You can calculate a mean for any distribution of numbers. It is just a simple mathematical operation.

But if the scores are scattered all over the place, then that mean really is not a good representation of the distribution as a whole.

Hence the need to report the standard deviation along with the mean.

If most of the numbers in the distribution are clustered very close to the mean - that is, if the mean gives you a really good picture of what the scores in the distribution tend to be - then the standard deviation will be a small number.

But if the scores are NOT clustered around the mean - that is, the scores are scattered all over the place and thus the mean does NOT provide you with a good idea of what the entire distribution of scores look like - then the standard deviation value will be quite large.

Conceptually, that is why you need both - at the end of the day, the standard deviation tells you whether the mean is truly representative of the distribution of scores as a whole.

For example, say you give a class of students a test, and the mean “average” test score computes to a 77.

That tells you something about how the class as a whole performed.

But it is not the entire story.

Did most of the students tend to score arounf the mean of 77? If so, the standard deviation will be a small number.

Or did the scores fall all over the place, with some students scoring in the high 90s or even 100, while others scored in the 30’s or 40’s? If so, the standard deviation will be quite large.


But it is difficult, in practice, to figure out what constitutes a “small” standard deviation in a given situation, and what constitutes a “large“ standard deviation.

So, read on in my next post, and I will address this.
 

Barry Natchitoches

Has No Life - Lives on TB
In theory, the larger the standard deviation, the more scattered away from the mean the scores tend to be. The mean is not a good descriptor, if the individual scores are scattered all over the place.

Or conversely, the smaller the standard deciation, the closer the scores tend to fall to the mean. The less scattered the scores are in the original distribution, the better the mean is at describing the distribution as a whole. Smaller standard deviations are the result when scores tend to be clustered together.


The thing is, In actual practice, it can be difficult to determine if a distribution’s standard deviation is close to the mean or not.


So statisticians have developed a simple mathematical transformation that they can perform, which makes such determinations easy peasy.

We refer to the process as “standardizing the data”.

In practice, What it means is that, after performing the very simple mathematical process, we can immediately figure out just how typical that mean really is of the whole group of scores in the distribution. Standardizing the data using that simple mathematical transformation makes clear a number that would otherwise be hard to interpret.


This is what we are doing when we calculate the “standard error of the mean.”


Unlike a raw score standard error - which in the classroom test results example I provided above might equal 1, or 10, or 12, or 30 or whatever - the standard error of the mean is a “standardized” score that you can clearly interpret every time.

It is calculated by dividing the distribution’s standard deviation by the square root of the number of data points in the distribution.

This is actually a pretty easy mathematical transformation to make, and is well wirth the trouble.

Because now, you can clearly see just how well the mean describes that distribution.

Additionally, you can compare two (or more) different distributions that have different raw score means and standard deviations. Only after “standardizing” the raw score standard deviations can you compare the scores in two different distributions.

Remember the infamous bell shaped curve from your elementary statistics class?

So many things in the natural world, business world, educational world - tends to fall in a bell shape, with there being few scores that are alot lower than the mean, a few really high scores way higher then the mean, and a whole lot of scores that fall right near the mean.

Well, this bell curve not only holds its shape when comparing individual scores inside the individual distribution under examination (the most common use of the bell curve), but by using the standard error of the mean, we can easily determine if the mean is truly representative of the scores in the distribution as a whole.

How so?

Well, when you divide the raw score standard deviation by the square root of the sample size, the resulting value is almost always somewhere between (-3.00) and (+3.00).

When looking at any sampling distribution that falls along a bell curve (which is most of them), the closer the standard error of the mean is to the value of zero, the closer the raw scores in that distribution cluster together in the original distribution, and hense, the better the mean is at describing the sores in that distribution.

But the further out the standard error of the mean falls from the center point of the bell curve - that is, the closer the standard error of the mean is to either (-3.00) or (+3.00), then the poorer that mean is when it comes to describing the original distribution.


The bell curve has fixed, known boundaries to help us figure out how to interpret any given distribution’s standard error of the meam.

If the standard error of the mean computes to somewhere between (-1.38 ) and (+1.38), then we figure that the mean is really a good description of the scores as a whole.

If the standard error of the mean computes somewhere between (-2.94) and (-1.39) below the mean or else between (+1.39) and (+2.94) then the distribution’s mean is not so good at describing the origional distribtion.

If the standard error of the mean is calculated to be (-2.95) or less — or if it computes out to be (+2.95) or greater — than, either way, the mean is completely useless as an adequate descriptor of the scores in the original distribution.


This, Kris, is why I feel that reporting the standard deviation (and also the sample size) is so important in any report.


The mean alone tells me very little.

So I know the arithmatic average. Big deal.

Were the scores in that distribution clustered near that mean?

Or were they scattered all about?


Without having the standard deviation and sample size (the two things I need to have, in order to calculate the standard error of the mean), I will never know.


And who wants to rely on a mean to describe a distribution, where the scores are scattered all over the place?


BTW, the above two posts essentially summarize most of what I teach in the first FIVE WEEKS of my Statistics 101 class.

I hope this helps.

My wife has chemo tomorrow, so I do not know when I can get back, but I will get back when I can, if you or somebody else has questions.
 
Last edited:

night driver

ESFP adrift in INTJ sea
There is NOTHING quite like seeing just how weak one's contributions may be and how far back in the distance one's technical quals actually are.

Kris, I apologize about the lack of assistance. NUTTIN like finding oneself a hazbeen.
 

Raffy

Veteran Member
Kris, it appears that what you've done is correct. But you may want to ask your VP what his/her goals are in asking for the standard deviation. It sounds like the desire is to gage the variability in project completion times. From what you have shown, there is quite a variability in project times at your company, with a SD of 7.5 months and a mean of 10 months. That's a rather large coefficient of variation of about 75% (SD/Mean x 100 percent). Would the VP want to use that data to reduce the overall time it takes to complete projects to reduce that scatter? Or might the goal be to reduce the average completion time?

Another option you might consider to get a better idea of the variability in times is to do a mean deviation in addition to the standard deviation. I believe that is also an option in Excel (it's basically the sum of the differences between each value and the mean divided by the total number of values, if that makes any sense, LOL). It is generally a bit less affected by extreme values than the standard deviation is. Maybe you could run that and then present that to your VP for consideration in addition to the standard deviation.

In my experience as an engineer (and I'm no statistics expert but I have used statistics quite a bit in looking at data, many times using the Excel functions as you have), I've found it helpful to use both the standard deviation and mean deviation to compare data.
 

Kris Gandillon

The Other Curmudgeon
_______________
Hi Kris,

What does this mean? It means that your average project length is about 10 months, but the actual time you will spend on any one project is incredibly dependent upon project complexity. Fully two thirds of your projects are completed in roughly 2 to 17 months.

Look at those numbers.

That is a huge difference. Even more confounding... 1 out of 3 projects will take either less than about two months or more than almost a year and a half!

Given the wide variability in time-to-complete, and the rapidly expanding number of projects you will need to complete, you must quickly determine how to best expend your limited resources. You need to do three things, if you have not already done so:

  1. Identify less than a dozen or so inherent factors which you may use to accurately estimate the complexity of each project.
  2. Develop an extrapolation technique based upon project complexity to estimate the required effort and time to complete each project.
  3. Ask each project submitter to document each project’s ultimate cost-saving or revenue enhancement in terms of dollars. You may have to assist them with this estimate depending upon the technical skills of your users. Please note, though, that sometimes this estimate will be no more than an educated best guess.

With these three factors, you may calculate, as best you may, each project’s return on investment (the famous ROI) and maximize said ROI by spending your time and efforts on the most beneficial projects first. That is, you want to prioritize work on shorter-term projects that return the largest benefit to your company. Of course, you may work on longer-term projects, but longer-term projects require a concomitant increase in returned benefit to justify their higher priority.

BTW, this approach also provides a carefully documented reason for delaying a project start-up should you need to justify your decision. Of course, you should also be aware that this approach must provide some flexibility in order to accommodate projects of an immediate, regulatory, or legal nature.

These are just my first thoughts on the extraordinary set of circumstances confronting you. If you already have such a procedure in mind or in practice, please forgive my impertinence.

Your Friend,
Uhhmmm.
Thanks for the feedback but I did cover most of your observations, questions, concerns in my “backstory” post #23 above linked below:


And noted this at the end:

Our circumstances involve solving mandated, regulatory requirements that must be fulfilled.
 
Last edited:
Top