northern watch
TB Fanatic
Book by John MaunderExtreme Cold and Heavy Snow to smash South Africa, + 'The Year Without a Summer', by John Maunder (electroverse.net)

Articles Crop Loss Extreme Weather GSM
EXTREME COLD AND HEAVY SNOW TO SMASH SOUTH AFRICA, + ‘THE YEAR WITHOUT A SUMMER’, BY JOHN MAUNDER
JULY 12, 2021 CAP ALLON
Another major Antarctic front will make landfall in Southern Africa today, Monday, July 12 — gale force winds, extreme cold, heavy snow, high waves, and torrential rains are ALL in the forecast.
It will be very cold in the Western and Northern Cape this week, warned the South African Weather Service (SAWS) on Sunday.
Snow as deep as 20cm (8 inches) is forecast to accumulate along the western mountains of the Western Cape, and SAWS has issued a rare ‘Level 4’ snowfall warning as a result — “Blimey, it’s not often we see one of these,” is how thesouthafrican.com puts it.
Power utility company Eskom has urged South African’s to reduce electricity usage during the big freeze.
The company has also warned that ‘load-shedding’ is likely, writing in a statement: “The cold front will increase the demand for electricity thereby putting pressure on the power system.”
View: https://twitter.com/Eskom_SA/status/1414471278094864384
The SA Weather Service has told farmers and growers to brace for significant livestock and crop losses.
“This is going to bring lots of very cold weather,” said Government spokesperson, James-Brent Styan.
“In the rural areas we want to caution people about the cold weather that can be expected, (which) poses a risk to people being outdoors as well as vulnerable livestock,” continued Styan, speaking to sabcnews.com.
View: https://twitter.com/SAWeatherServic/status/1414112598484791297
The cold front will enter Cape Town on Monday morning.
It will deliver strong winds from Cape Colombine to Cape Agulhas, reports sowetanlive.co.za, with infrastructure damage along the Western Cape coastline likely.
By Tuesday, July 12, extreme temperature anomalies of as much as 20C below the seasonal norm will have engulfed South Africa, Botswana, Namibia:

GFS 2m Temperature Anomalies (C) for Tues, July 12 [tropicaltidbits.com].
Theses “blues” and “purples” will gain further territory northward as the week progresses — into Mozambique, Zimbabwe, Zambia, and Angola by Wednesday, July 14.
View: https://twitter.com/SAWeatherServic/status/1414114974495092736
SA meteorologists Wayne Venter and Kate Turner expect the polar blast to persist in the Northern, Eastern, and Western Cape throughout the week, with widespread frost forecast Wednesday through Friday.
The forecasters warned of rain leading to flooding in Cape Town, Drakenstein and Stellenbosch.
While rare level 4 snowfall warnings have also been issued for both Monday and Tuesday, most notably in Namakwa, in the Northern Cape, as well in Cederberg, Witzenberg and Breede Valley, in the Western Cape.
Garden Route should expect heavy snow totals on Tuesday afternoon.
LOOKING FURTHER AHEAD
The models are suggesting another extreme cold front will batter the region later in the month.
This one threatens to be even more intense than the first, and, as it stands, is on course to send the mercury across eastern South Africa and southern Mozambique some 22C below the winter norm.
It has the potential to deliver record cold to the region, and further debilitating snowfall.

GFS 2m Temperature Anomalies (C) for Weds, July 21 [tropicaltidbits.com].

GFS 2m Temperature Anomalies (C) for Thurs, July 22 [tropicaltidbits.com].
An anomalously cold Antarctica has been firing numerous icy shots over Southern Hemisphere land masses in recent weeks — from South America to Australia, and from Southern Africa to New Zealand, wave after wave of powerful polar air masses have been engulfing the lower latitudes:

Rare July Frost and Record Cold hit Minnesota, S. America Corn suffers due to "unusual cold", as additional Polar Blasts strike Australia and New Zealand
The global temp has dropped 0.7C since the start of 2016. Looking ahead, climatic patterns look set to accelerate this cooling into 2022.electroverse.net
A unusually cold Antarctica has also seen the continent’s sea ice extent track well-above the 1979-1990 average this year, with the latest data point –from July 10 (or day 191)– actually accelerating that growth, to 15.707 million km2:

[NSIDC]
Stay tuned for updates.
THE YEAR WITHOUT A SUMMER, BY JOHN MAUNDER
Some of the answers to the complexities of the climate system are given John Maunder’s recently published book Fifteen shades of climate… the fall of the weather dice and the butterfly effect.
The following are extracts from pages 203- 207:
The 19th Century weather disaster – dubbed “The Year Without a Summer” – happened in 1816, when the weather in Europe and North America took a bizarre turn which resulted in widespread crop failures and famine.
On April 10, 1815, Mount Tambora in Indonesia produced the largest eruption known on the planet during the last 10,000 years. The volcano erupted more than 50 cubic kilometres of magma. The eruption produced global climatic effects and killed more than 100,000 people, directly and indirectly. Pyroclastic flows reached the sea on all sides of the peninsula, and heavy tephra fall devastated croplands, causing an estimated 60,000 fatalities. Entire villages were buried under thick pumice deposits. Some of the settlements have recently been brought back to light by archaeological excavations, making a site called ‘Pompeii of Indonesia’. While the death toll of people living on Sumbawa and surrounding coastal areas was high enough, even more fatalities can be attributed to an indirect effect of global climate deterioration after the eruption.
These changes turned 1816 into ‘The Year without a Summer’ for much of Europe, causing widespread famine. The reason for the climatic changes was increased absorption of sunlight due to a veil of aerosols dispersed around both hemispheres by stratospheric currents from the tall eruption column. Global temperatures dropped by as much as 3°C in 1816.
UNPRECEDENTED WEATHER IN 1816
‘The Year without a Summer’ was well reported in the United States and Europe, as the following description suggests.
The weather in 1816 was unprecedented. Spring arrived but then everything seemed to turn backward, as cold temperatures returned. The sky seemed permanently overcast. The lack of sunlight became so severe farmers lost their crops and food shortages were reported in Ireland, France, England, and the United States. In Virginia, Thomas Jefferson retired from the presidency and farming at Monticello sustained crop failures that sent him further into debt.
It would be more than a century before anyone understood the reason for the peculiar weather disaster: the eruption of an enormous volcano on a remote island in the Indian Ocean one year earlier had thrown enormous amounts of volcanic ash into the upper atmosphere.
But before the cause was known, in Switzerland, the damp and dismal summer of 1816 led to the creation of a significant literary work. A group of writers, including Lord Byron, Percy Bysshe Shelley, and his future wife, challenged each other to write dark tales inspired by the gloomy and chilly weather. During the miserable weather Mary Shelley wrote her classic novel Frankenstein.
The Albany Advertiser went on to propose some theories about why the weather was so bizarre.
The mention of sunspots is interesting, as sunspots had been seen by astronomers. What’s fascinating is the newspaper article from 1816 proposes such events should be studied, so people can learn what is going on. For example:
“Many seem disposed to charge the peculiarities of the season, the present year, upon the spots on the sun. If the dryness of the season has in any measure depended on the latter cause, it has not operated uniformly in different places – the spots have been visible in Europe, as well as in the United States and yet in some parts of Europe, as we have already remarked, they have been drenched with rain.”
“Without undertaking to discuss, much less to decide, such a learned subject as this, we should be glad if proper pains were taken to ascertain, by regular journals of the weather from year to year, the state of the seasons in this country and Europe, as well as the general state of health in both quarters of the globe. We think the facts might be collected, and the comparison made, without much difficulty; and when once made, that it would be of great advantage to medical men, and medical science.”
VOLCANIC HAZARDS
Today, in 2021, we now know volcanoes can pose many hazards. One hazard is that volcanic ash can be a threat to jet aircraft where ash particles can be melted by the high operating temperature. The melted particles then adhere to the turbine blades and alter their shape, disrupting the operation of the turbine.
Large volcanic eruptions can affect temperature, as ash and droplets of sulphuric acid obscure the sun and cool the Earth’s lower atmosphere, or troposphere. However, they also absorb heat radiated up from the Earth, thereby warming the upper atmosphere, or stratosphere. Historically, socalled volcanic winters have caused catastrophic famines.
From Wood, Gillen D’Arcy, ‘1816, The Year without a Summer’. Britain, Representation and Nineteenth-Century History. Ed. Dino Franco Felluga. Extension of Romanticism and Victorianism on the Net, we read the following:
“To be alive in the years 1816-18, almost anywhere in the world, meant to be hungry. Across the globe during the so-called ‘Year without a Summer’ – which was, in fact, a three-year climate crisis – harvests perished in frost and drought or were washed away by flooding rains. Villagers in Vermont survived on hedgehogs and boiled nettles, while the peasants of Yunnan in China sucked on white clay. Summer tourists travelling in France mistook beggars crowding the roads for armies on the march.”
“Famine-friendly diseases cholera and typhus stalked the globe from India to Italy, while the price of bread and rice, the world’s staple foods, skyrocketed with no relief in sight. Across a European continent devastated by the Napoleonic wars, tens of thousands of unemployed veterans found themselves unable to feed their families. They gave vent to their desperation in town square riots and military-style campaigns of arson, while governments everywhere feared revolution. In New England, 1816 was nicknamed ‘Eighteen-Hundred-and-Froze-to-Death’ while Germans called 1817 ‘The Year of the Beggar’. ”
“In the scientific literature, the 1816’s cold summer was the most significant meteorological event of the nineteenth century. The global climate emergency period of 1816-18, as a whole, offers us a clear window onto a world convulsed by weather anomalies, with human communities everywhere struggling to adapt to sudden, radical shifts in weather patterns, and to a consequent tsunami of famine, disease, dislocation and unrest.”
SURPRISE AURORAS
There were no auroras in the forecast on July 10.
Then, unexpectedly, a ‘crack’ opened in Earth’s magnetic field.
This allowed solar wind to rush in and fuel this impressive display:

[MaryBeth Kiczenski July 10, 2021]
The image was captured by MaryBeth Kiczenski while on a boat just off Pictured Rocks National Lakeshore in Michigan’s Upper Peninsula — and it again hints at our planet’s ever-waning magnetosphere as its magnetic poles continue their excursion.
Click the below article for more on that:

Earth's Magnetic Field AGAIN Fails to Deal with a weak Solar Wind Stream, + "this is 1984" - Electroverse
For the second time in a week, Earth's waning magnetosphere has failed to deal with a weak ejection from the Sun. This is a sign of the times -- a very disturbing one for those dependent on electrical infrastructure to survive (so 90% of the global population then).
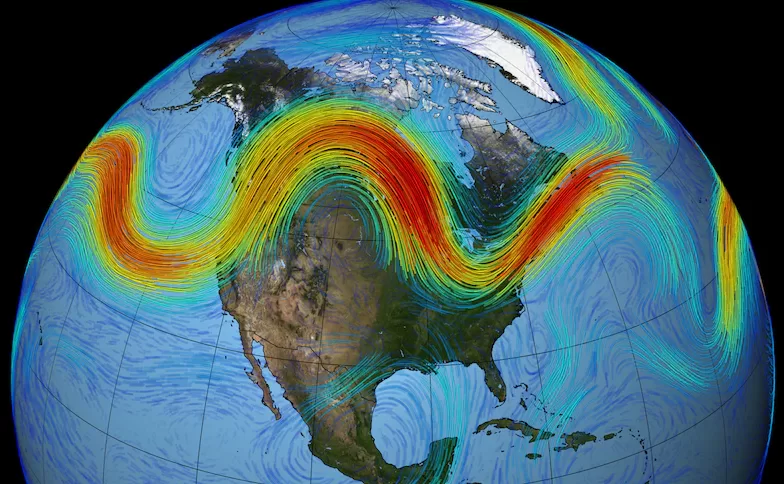
The COLD TIMES are returning, the mid-latitudes are REFREEZING, in line with the great conjunction, historically low solar activity, cloud-nucleating Cosmic Rays, and a meridional jet stream flow (among other forcings).
Both NOAA and NASA appear to agree, if you read between the lines, with NOAA saying we’re entering a ‘full-blown’ Grand Solar Minimum in the late-2020s, and NASA seeing this upcoming solar cycle (25) as “the weakest of the past 200 years”, with the agency correlating previous solar shutdowns to prolonged periods of global cooling here.
Furthermore, we can’t ignore the slew of new scientific papers stating the immense impact The Beaufort Gyre could have on the Gulf Stream, and therefore the climate overall.


Prepare accordingly— learn the facts, relocate if need be, and grow your own.


Fifteen Shades of Climate: The fall of the weather dice and the butterfly effect Paperback – Nov. 15 2020
by Dr John Maunder
Last edited: