Solar Grand Solar Minimum part deux

TxGal

Day by day
SOTT Earth Changes Summary - April 2021: Extreme Weather, Planetary Upheaval, Meteor Fireballs -- Earth Changes -- Sott.net

SOTT Earth Changes Summary - April 2021: Extreme Weather, Planetary Upheaval, Meteor Fireballs

Sott.net
Mon, 03 May 2021 14:59 UTC

secs421

A sudden pressure difference between Greenland and northern Europe triggered a massive arctic cold blast that plunged temperatures to historical records throughout Europe. The extreme cold arrived less than a week after a record-warm period at the final days of March.

The thermometers in Capanna Margherita, Italy plunged to -33,2°C, while Novi Vasi, Slovenia registered an all-time national record of -20°C. The UK was also hit by a new national April cold record with -6°C, just a few days after an all-time record for March of -15,4°C in Eskdalemuir. And while we are there, the Alps also reported the coldest April in history.

Very low temperatures with record-breaking cold and damaging frost were also reported in parts of France, Germany, and Croatia.

A cold blast from the Arctic Ocean pushed Alaska into a deep freeze breaking two records for snowfall and low temperatures for two consecutive days. The historic storm ranked among the most intense snowfalls since records started and snow cover reached as far south as Oklahoma.

Extreme cold temperatures with substantial snowfall totals to match hit the Moscow region this month. Weather conditions were akin to those suffered during the depths of winter. At the same time, the eastern region of Russia registered the greatest snow cover for April.

Are we recognizing the pattern here?

Typhoon Surigae became the most intense April tropical cyclone on record and battered the eastern Philippines with 190mph winds and intense rain. Parts of East Nusa Tenggara Province saw more than 20 inches of rain in 2 days.

Heavy rain and flooding also affected the central and northern areas of Colombia triggering landslides and damaging homes. Thousands of families were affected.

Hail as large as softballs battered portions of Texas and Oklahoma, leaving behind shattered windows on cars and in homes. It was the second billion-dollar disaster this year in Texas.

Hundreds of new sinkholes have been reported in Konya Province, Turkey since the start of the year, almost double the number registered last year.

All this and more in our SOTT Earth Changes Summary for April 2021:

View: https://youtu.be/nxOQxhIA5JY

Run time is 22:23

Watch it also on Sott.net's Vimeo channel:
(link won't copy over)

To understand what's going on, check out our book explaining how all these events are part of a natural climate shift, and why it is taking place now: Earth Changes and the Human-Cosmic Connection
 

Slydersan

Veteran Member
Figured this was relevant- from SpaceWeather.com -- News and information about meteor showers, solar flares, auroras, and near-Earth asteroids

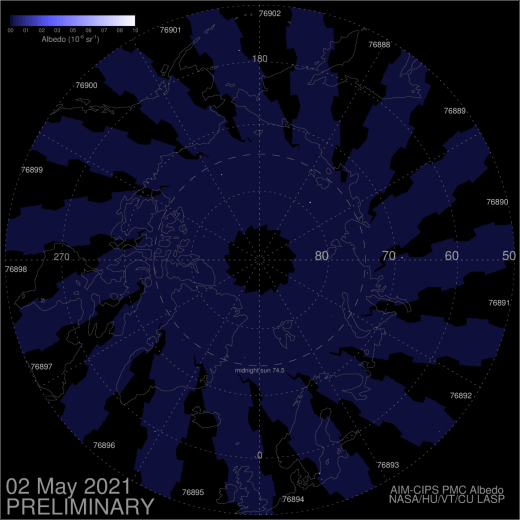
WAITING FOR NOCTILUCENT CLOUDS: It's time. Earth's north pole is about to light up with noctilucent clouds (NLCs). NASA's AIM spacecraft is scanning the Arctic Circle for the first signs of electric blue, but so far the images are blank:


When the season gets started, AIM images will look more like this.

NLCs are Earth's highest clouds. They form when summertime wisps of water vapor rise up from the poles to the edge of space. Water crystallizing around specks of meteor dust 83 km (~50 miles) above Earth's surface creates beautiful electric-blue structures, typically visible from May to August in the northern hemisphere.

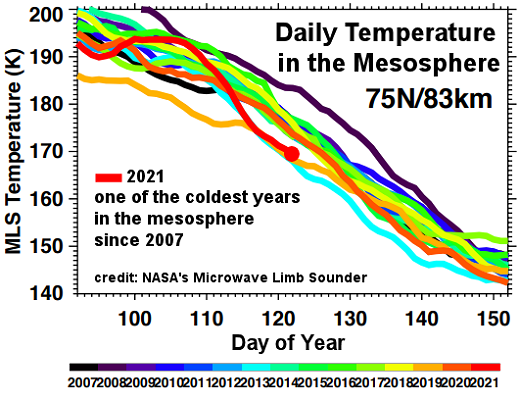
This could be a good year for NLCs. To form, the clouds require cold temperatures in the mesosphere. Really cold. "At the moment, 2021 is one of the coldest years since AIM was launched 14 years ago," says Cora Randall of the University of Colorado’s Laboratory for Atmospheric and Space Physics. Note the red line in this plot created by Randall's colleague Lynn Harvey:


Only 2 previous years rival the current chill of 2021--a good omen for NLCs. "If these low temperature trends continue, we might expect a relatively early onset this year," says Randall. "May 15th is the earliest we've seen before."

When will the first clouds appear? You might be the first to know. Daily images from AIM are posted right here on Spaceweather.com. Stay tuned!
 

TxGal

Day by day
Germany's Coldest April since 1977 (Solar Minimum of Cycle 20), as even NASA researchers note a Cooling Planet - Electroverse

iconairglownight-e1620210023113.png

Extreme Weather
GERMANY’S COLDEST APRIL SINCE 1977 (SOLAR MINIMUM OF CYCLE 20), AS EVEN NASA RESEARCHERS NOTE A COOLING PLANET
MAY 5, 2021 CAP ALLON

Europe is the region documented to have suffered most-greatly during previous Grand Solar Minimums (Dalton/Maunder), which makes sense given its close(ish) proximity to the pole along with its populous.
The onset of this next GSM is proving no different, even at this early stage…


As reported earlier this week, the European continent just suffered a historically cold month of April –which is now persisting into May– however; one nation I didn’t get to was Germany.

With an average temperature of just 6C (42.8F), April 2021 was Germany’s coldest fourth month of the year since that of 1977 (solar minimum of cycle 20). This average reading finishes some 3C below the 1991-2020 climatological norm, and 2.3C below the previously-used 30-year avg. of 1981-2010.

The month was also somewhat drier than average, reports DWD Klima and Umwelt on Twitter:

View: https://twitter.com/DWD_klima/status/1388885261640163331


Note the stark temperature drop in the chart @DWD_klima provides above.

Blowing it up (below), we see the plunge from April, 2020 to April, 2021 more clearly:


This an indication of just how quickly the climate can cool when conditions allow, conditions such as low solar activity and La Ninas.

Also crucial to note here is that the lag between low solar activity and terrestrial cooling now appears to be over.

The “cooling trend” registered by NASA in the ‘upper’ atmosphere over the past few years has now finally permeated down the atmospheric layers and to the global ‘lower’ atmosphere (where us humans reside).

“High above Earth’s surface, near the edge of space, our atmosphere is losing heat energy,” said NASA’s Martin Mlynczak, associate principal investigator for the SABER instrument onboard NASA’s TIMED satellite, back in 2018. “If current trends continue, it could soon set a Space Age record for cold”–which it did, in late-2018.


NASA’s TIMED-satellite.

SABER’s missions is to monitor infrared emissions from carbon dioxide (CO2) and nitric oxide (NO) — by measuring the infrared glow of these molecules, SABER can assess the thermal state of gas at the very top of the atmosphere: a layer researchers call ‘the thermosphere.’

“The thermosphere always cools off during Solar Minimum,” continued Mlynczak.

“It’s one of the most important ways the solar cycle affects our planet.”

To help keep track of what’s happening in the thermosphere, Mlynczak and colleagues recently introduced the ‘Thermosphere Climate Index’ (TCI)–a number expressed in Watts that tells how much heat NO molecules are dumping into space. During Solar Maximum, TCI is high (‘Hot’); during Solar Minimum, it is low (‘Cold’).

And although SABER has been in orbit for 2 decades, Mlynczak and colleagues have been able to calculate TCI going all the way back to the 1940s: “SABER taught us to do this by revealing how TCI depends on other variables such as geomagnetic activity and the Sun’s output–things that have been measured for decades,” he explains.


An historical record of the Thermosphere Climate Index. Mlynczak and colleagues recently published a paper on the TCI showing that the state of the thermosphere can be discussed using a set of five plain language terms: Cold, Cool, Neutral, Warm, and Hot.

Taking Mlynczak’s chart above –and more specifically its plotting of the past 6 solar cycles which fall directly in line with SABER’s Thermosphere Climate Index– it is revealed that this latest and historic round of low solar output didn’t begin until the minimum of cycle 23 (arguably 2008).

And with the impacts of 2016-17’s record-strong El Nino now fully faded, and effects of the moderate 2019-20 event also having dissipated (both clearly visible in the below chart), the cumulative reduction in activity through cycles 23 and 24 are finally impacting our ‘global’ temperature datasets, and not just regional ones — as mentioned above, the record cooling of the thermosphere has now worked its way down to the troposphere:


[drroyspencer.com]

Returning to the regional data for a moment, because I think its important we are aware of the impacts on the ground in order for us to properly prepare, Germany was one of the nations to report a rapid and intense terrestrial cooling during the previous Grand Solar Minimum, the more moderate Dalton Minimum (1790-1830).

The country’s Oberlach Weather Station, for example, experienced a 2C decline over just 20 years during the beginning of the 1800s — this rapid cooling devastated the country’s food production, and contributed to the starvation of millions upon millions of people across Eurasia. It also puts to bed then tion that such stark shifts in the climate take centuries to manifest — this is not true, historical documentation –not to mention proxy data– shows us that ice age conditions can descend within just a matter of years.

Germany’s stark temperature drop from April 2020 to April 2021 provides further evidence for this.

THE DAY’S OTHER ARTICLE:


The COLD TIMES are returning, the mid-latitudes are REFREEZING in line with the great conjunction, historically low solar activity, cloud-nucleating Cosmic Rays, and a meridional jet stream flow (among other forcings).

Both NOAA and NASA appear to agree, if you read between the lines, with NOAA saying we’re entering a ‘full-blown’ Grand Solar Minimum in the late-2020s, and NASA seeing this upcoming solar cycle (25) as “the weakest of the past 200 years”, with the agency correlating previous solar shutdowns to prolonged periods of global cooling here.

Furthermore, we can’t ignore the slew of new scientific papers stating the immense impact The Beaufort Gyre could have on the Gulf Stream, and therefore the climate overall.


Prepare accordinglylearn the facts, relocate if need be, and grow your own.
 

TxGal

Day by day
Posting a large article from Electroverse, the first part is below:

Physicist William Happer: "There is NO Climate Emergency ... Renewable Energy is the inverse Robin Hood strategy ... doubling CO2 makes no difference" - Electroverse

2021_03_11_happer_02_1400x787-e1620212739631.jpg

Articles
PHYSICIST WILLIAM HAPPER: “THERE IS NO CLIMATE EMERGENCY … RENEWABLE ENERGY IS THE INVERSE ROBIN HOOD STRATEGY … DOUBLING CO2 MAKES NO DIFFERENCE”
MAY 5, 2021 CAP ALLON

William Happer is an American physicist with over 200 published peer-reviews scientific papers. He is the Cyrus Fogg Brackett Professor of Physics, Emeritus, at Princeton University, and has also worked for the U.S. government on two separate occasions: the first was between 1991-1993, where he served as Director of Energy Research, and the second between 2018-2019 under the Trump administration, where he was Depute Assistant to the President for Emerging Technologies at the National Security Council.

Dr. William Happer spoke at the National Leadership Seminar, sponsored by Hillsdale College, on February 19, 2021, in Phoenix, Arizona. Below is a breakdown of his talk, including the slides he shared:


The best way to think about the frenzy over climate is to consider it a modern version of the medieval Crusades. You may remember that the motto of the crusaders was “Deus vult!”, “God wills it!” It is hard to pick a better virtue-signaling slogan than that.


Most climate enthusiasts have not gone so far, but some actually claim that they are doing God’s work. After decades of propaganda, many Americans, perhaps including some of you here today, think there really is a climate emergency. Those who think that way, in many cases, mean very well. But they have been misled.

As a scientist who actually knows a lot about climate (and I set up many of our climate research centers when I was at the Department of Energy in the early 1990s) I can assure you that there is no climate emergency. There will not be a climate emergency. Crusades have always ended badly. They have brought discredit to the supposed righteous cause. They have brought hardship and death to multitudes. Policies to address this phony climate emergency will cause great damage to American citizens and to their environment.

Climate frenzy is really heating up recently. On February 4th Senator Bernie Sanders, Congresswoman Alexandra Ocasio-Cortez, and Congressman Earl Blumenauer introduced “legislation mandating the declaration of a national climate emergency.

The National Climate Emergency Act directs the President of the United States to declare a national climate emergency and mobilize every resource at the country’s disposal to halt, reverse, mitigate and prepare for the consequences of this climate crisis.” (This is from Mr. Blumenauer’s website.) But this is utter nonsense. There is no climate crisis, and there will not be a climate crisis

It gets worse when you get to the state levels where there are fewer checks and balances.

These are the remarks made last week by Charles Ismay, the Undersecretary for Climate Change in Massachusetts to the Vermont Climate Council:

“So let me say that again, 60% of our emissions that need to be reduced come from you, the person across the street, the senior on fixed income, right . . . there’s no bad guy left, at least in Massachusetts to point the finger at, to turn the screws on, and you know, to break their wills, so they stop emitting. That’s you. We have to break your will. Right, I can’t even say that publicly.”

A few days later Mr. Ismay resigned and had he not, his governor would have fired him. But, that’s the way crusades are. This is really not a question of science. This is a question of a secular religion for some. It is a question of money for others. It is a question of power for others. But whatever it is, it is not science.

Part of the medieval crusades was against the supposed threat to the holy sites in Jerusalem. But a lot of it was against local enemies. The medieval Inquisition really did a job on the poor Cathars, on the Waldensians of southern France, and on the Bogomils in the Balkans. Climate fanatics don’t know or care any more about the science of climate than those medieval Inquisitors knew or cared about the teachings of Christ.

Just about everyone wants to live in a clean environment. I do, and I am sure everyone here does.


This is a photograph of Shanghai, and that’s real air pollution. You can just barely see the Bottle Opener Building in the back through all the haze. Some of this is due to burning coal. But a bigger fraction is due to dust from the Gobi Desert.
They have had this type of pollution in Shanghai since the days of Marco Polo and long before. Part of it is burning stubble of the rice fields, which is traditionally done before planting next year’s crop. This is real pollution. I would not want to live in a city like that. If there is anything to do that would make it better, I would certainly support that.

But, none of this has anything to do with CO2. CO2 is a gas you cannot see, smell or taste. So, hare-brained schemes to limit emissions of CO2, which is actually beneficial, as I will explain a little bit later, will only make it harder to get rid of real pollutants like what I just showed you in Shanghai.

So, let’s talk about CO2.

Number one, it is not a pollutant at all. We breathe out lots of CO2. Many people are surprised to learn that they exhale a little more than two pounds of CO2 a day. You people in this room are putting out a lot of CO2. I actually brought a CO2 meter here which I am going to turn on. But our breath is not that different from the output of a power plant. Power plants take in normal air, and they consume most of the oxygen by burning coal, or natural gas, or oil. The exhaust that comes out of the stack is mostly the nitrogen that was already there—a little bit of oxygen that was not used up, along with water vapor and CO2.

Our breath is similar, except it has a lot more oxygen. So, you can give mouth-to-mouth resuscitation, but you couldn’t if your breath was like the power plant exhaust. Your breath contains about four percent CO2, six percent water. The power plant has a bit more CO2 and correspondingly less oxygen. But our breath is definitely not a pollutant. In fact, our breathing reflex is determined by CO2. It is not determined by oxygen. It is not a lack of oxygen; it is too much CO2 that makes you take another breath of air.

This is a picture of my wife Barbara in New Jersey near a new solar farm:


We have just seen how well solar farms and windmills work in Texas in last week’s (historic) cold spell.
They never did work terribly well. We have to be grateful to Nature. She seems to have a sense of humor, and she has taught us a good lesson—I hope; but people seem to be slow learners.

A major problem with renewable energy sources (solar, wind) is that they take up a lot of space. (Also,) you need something else to provide electrical power at night. Solar panels do not work if it is a cloudy day. They do not work terribly well in the winter when the Sun is low. Solar power makes no economic sense unless you are massively subsidized by the state and federal governments. So, it is pure virtue signaling.


Here is an early wind farm in California. It is beginning to fall to pieces, but all wind farms fall to pieces. Nobody quite knows how we are going to dispose of all of this junk when it no longer works.

Wind has much the same problems as solar. When I was a kid, people did not sit in front of computer screens all day and look at simulations of the world. You could go outside and look up at the clouds and see what the weather was like. And in those days, people knew that “the wind bloweth where it listeth.” Sometimes it blows, sometimes it doesn’t. Last week in Texas, the wind didn’t blow very much. And, when it was trying to blow the wind turbine blades were iced over and did not turn.

Renewable energy is what I would call the inverse Robin Hood strategy—you rob from the poor to give to the rich. Utilities are permitted to raise rates because of their capital investments in inefficient, unreliable renewables. They junk fully depreciated coal, gas and nuclear plants, all of which are working beautifully, and producing inexpensive, reliable energy. But regulated profits are much less. Taxpayers subsidize the rich, who can afford to lease land for wind and solar farms. Tax incentives pander to the upper class who live in gated communities and can afford to buy Tesla electric cars. They get subsidies from the state and federal government. They even get subsidized electrical power to charge up their toys. The common people have little spare income for virtue signaling. They pay more and more for the necessities of life in order to subsidize their betters.

You cannot spend a lifetime as a professor and not relapse from time to time into giving a classroom lecture. So, you will have to expect to be lectured for a few minutes. The good news is that there will be no quiz. But for those of you who share my view that this climate hysteria is serious nonsense, it helps to know what the facts are. I hope I can arm some of you with the real scientific facts.


This is a picture of the overall circulation of the atmosphere around the Earth.

What keeps us warm on Earth is the Sun.

The Earth is most intensely heated in the tropics. That is the reddish area on this chart, where the Sun is most nearly overhead at noon. There is more solar energy coming in at the tropics than goes out as cooling radiation to space. The excess heat must be convected to polar regions by warm air and ocean water.

Like the Sun, the Earth also radiates.

If you have had dinner here at the Marriott, maybe you sat under some of the infrared radiators on the outside patios. You cannot see it, but you can feel the warm, the thermal radiation from the patio heaters.

Earth maintains its temperature by balancing the solar heating during the day with thermal radiation cooling to cold space, both during the day and night.

Climate involves a complicated interplay of the sunlight that warms us, and thermal infra-radiation that escapes to space. Heat is transported from the tropics to the poles by the motion of warm air and ocean water. We all know about the Gulf Stream that carries huge amounts of heat to northern Europe, even to Russia. Movements of air in the atmosphere also carry a lot of heat, as we know from regular cold spells and hot spells.

If you look at the viewgraph, you can estimate where Phoenix is, just over the Mexican border. That is where the color changes from yellow to green. This area is often under the descending branch of the Hadley Cell, air that rises up near the Equator, hot air, moist air, full of water vapor. There is tremendous rainfall down there. As the air rises to really high altitudes, 10 to 15 kilometers, most of the water is wrung out. Some of this freeze-dried air heads north and some heads south. The air that heads north eventually falls back down to the Earth, often onto Phoenix. On average, this dry air pours down at latitudes around 30 degrees north and 30 degrees south of the Equator. That is where we find the great desert belts of the Earth. That is where the Sahara Desert is, the Chihuahuan Desert, and to the south, the Kalahari Desert. The Hadley circulation is like the gas flow loop of a giant, Brayton-cycle heat engine. Over most of its path, the circulating air does not turn any wind-turbine blades.

Here is a picture of Earth’s energy budget:


I mentioned we are warmed by the Sun. About half of the sunlight eventually gets to the surface. What prevents it all from reaching the surface are clouds and a small amount of scattering and absorption by the atmosphere.

Other parts of America, like New Jersey, now are covered with clouds. Those areas do not get any sunlight directly. But the half of sunlight that does reach the ground heats it. You can notice that in the afternoon, if you go outside. If you are a gardener like me, you can put your hands in the soil and it is nice and warm. It makes the corn grow. But that heat has to be released. If you keep adding heat to the ground, it gets hotter and hotter. So, the heat is eventually released by radiation into space which is that red arrow going up on the viewgraph. But for the first few kilometres of altitude, a good fraction of that heat is not carried by radiation, but by convection of warm, moist air. CO2 has no direct effect on convection near the surface. But once you get up to 10 kilometres or so, most of the heat is transported by radiation.

----------------------------------------------------------
Continues below
 
Last edited:

TxGal

Day by day
2nd part is below:

By the way, I have the (CO2) meter running now. Remember that the outside air is 400 parts per million CO2. It is 580 in here, (and) it was at 1,000 parts per million where we were having lunch. CO2 levels are never stable near Earth’s surface. People are panicking about one or two parts per million of CO2. Now, the meter reads 608 parts per million—that is probably because I breathed on it. Hot air sets it off. I sometimes take the meter out onto my back porch. At the end of a summer day, the CO2 levels on my back porch drop to maybe 300 parts per million, way below the average for outside air. That is because the trees and grass in my backyard have sucked most of the CO2 out of the local air during the day. If I get up early the next morning and I look at the meter, it is up to 600 parts per million. So just from morning to night CO2 doubles in the air of my back yard. Doubles and halves, doubles and halves. At least during the growing season that is quite common. And we have these hysterics about CO2 increasing by 30 or 40 percent. It is amazing.


So, why the frenzy over CO2?

It is because it is a greenhouse gas? That is true. This is a somewhat deceptive picture. What it shows in red (in the above image) is sunlight, and the horizontal scale on the top panel is the wavelength of the sunlight.

Radiation wavelengths for sunlight are typically about a half a micron (half a millionth of a meter). That is green light, the color of green leaves. The thermal radiation that cools the Earth is that blue curve to the right of the upper panel, and that is a much longer wavelength, typically around 10 microns.

So, the wavelength of thermal radiation is 10 to 20 times longer than the wavelengths of sunlight. It turns out that the sun’s energy can get through the Earth’s atmosphere very easily. So essentially all sunlight or at least 90 percent, if there are no clouds, gets to the surface and warms it. But radiation cooling of the surface is less efficient because various greenhouse gases (most importantly water vapor, which is shown as the third panel down, and CO2, which is the fourth panel down) intercept a lot of that radiation and keep it from freely escaping to space. This keeps Earth’s surface temperature warmer than it would be (by about 20 or 30 degrees). The Earth would be an ice cube if it were not for water vapor and CO2.


Greenhouse gases were discovered in the 1850s by John Tyndall, who was an Anglo-Irish physicist working in London. He was the first one to discover that water vapor, or carbon dioxide, or ether vapor, or alcohol vapor, intercept thermal radiation.

Appropriately for an Anglo-Irishman, he used a hot tea kettle as his source of heat. He measured the thermal radiation from the tea kettle that passed through a pipe containing various gases, and he noticed that certain gases like CO2, or especially water vapor, would block much of that heat radiation whereas the normal atmospheric gases nitrogen and oxygen would not.

All atmospheric gases are transparent to sunlight, but greenhouse gases are partly opaque to thermal radiation.
We now call the gases that block heat-radiation “greenhouse gases.”

CO2 is indeed a greenhouse gas, but it is not a very good greenhouse gas at today’s concentration.
Let me show you something that I want you to remember:


This is an important slide.

There is a lot of history here and so there are two historical pictures. The top picture is Max Planck, the great German physicist who discovered quantum mechanics. Amazingly, quantum mechanics got its start from greenhouse gas-physics and thermal radiation, just what we are talking about today. Most climate fanatics do not understand the basic physics. But Planck understood it very well, and he was the first to show why the spectrum of radiation from warm bodies has the shape shown on this picture, to the left of Planck.

The horizontal scale, left to right is the “spatial frequency” (wave peaks per cm) of thermal radiation. The vertical scale is the thermal power that is going out to space. If there were no greenhouse gases, the radiation going to space would be the area under the blue Planck curve. This would be the thermal radiation that balances the heating of Earth by sunlight.

In fact, you never observe the Planck curve if you look down from a satellite. We have lots of satellite measurements now. What you see is something that looks a lot like the black curve, with lots of jags and wiggles in it. That curve was first calculated by Karl Schwarzschild, whose picture is below Planck’s picture.

------------------------------------------------------------------

Next part follows below.
 

TxGal

Day by day
3rd part:

Schwarzschild was an officer in the German army in World War I, and he did some of his most creative work in the trenches on the eastern front facing Russia. He found one of the first analytic solutions to Einstein’s general theory of relativity while he was there on the front lines. Alas, he died before he got home. The cause of death was not Russian bullets but an autoimmune disease. This was a real tragedy for science. Schwarzschild was the theorist who first figured out how the real Earth, including the greenhouse gases in its atmosphere, radiates to space. That is described by the jagged black line.

The important point here is the red line.

This is what Earth would radiate to space if you were to double the CO2 concentration from today’s value. Right in the middle of these curves, you can see a gap in spectrum. The gap is caused by CO2 absorbing radiation that would otherwise cool the Earth. If you double the amount of CO2, you don’t double the size of that gap. You just go from the black curve to the red curve, and you can barely see the difference. The gap hardly changes.

The message I want you to understand, which practically no one really understands, is that doubling CO2 makes almost no difference. Doubling would replace the black curve by the red curve. On the basis of this, we are supposed to give up our liberties. We are supposed to give up the gasoline engines of our automobiles. We are supposed to accept dictatorial power by Bernie Sanders and Ocasio-Cortez, because of the difference between the red and the black curve. Do not let anyone convince you that that is a good bargain. It is a terrible bargain. The doubling actually does make a little difference. It decreases the radiation to space by about three watts per square meters. In comparison, the total radiation to space is about 300 watts per square meter. So, it is a one percent effect—it is actually a little less than that, because that is with no clouds. Clouds make everything even less threatening.

Finally, let me point out that there is a green curve. That is what happens if you take all the CO2 out of the atmosphere. No one knows how to do that, thank goodness, because plants would all die if you took all the CO2 out of the atmosphere. But what this curve is telling you is that the greenhouse effect of CO2 is already saturated. Saturation is a jargon term that means CO2 has done all the greenhouse warming it can easily do. Doubling CO2 does not make much difference. You could triple or quadruple CO2 concentrations, and it also would make little difference. The CO2 effects are strongly saturated.


You can take that tiny difference between those curves that I showed you, the red and the black curves, and calculate the warming that should happen. I was one of the first to do this: in 1982 I was a co-author of one of the first books on radiative effects of CO2. (Above) is my calculation and lots of other people’s calculations since. It is a bar graph of the warming per decade that people have calculated. The red bar is what has actually been observed. On the right is warming per decade over 10 years, and on the left, over 20 years. In both cases the takeaway message is that predicted warmings, which so many people are frantic about, are all grossly larger than the observed warming, which is shown by the red bars.

So, the observed warmings have been extremely small compared to computer calculations over any interval that you consider. Our policies are based on the models that you see here, models that do not work. I believe we know why they do not work, but no one is willing to admit it.


Here is another comparison of models and observations.

The red curve here on the bottom is the year. It starts in 1975. It goes through 2025 because model predictions are included. The top curve is predictions by the international climate-alarm establishment, and the bottom blue and green curves are observations.

The blue circles summarize temperatures measured with balloons. You probably know that every day thousands of balloons are launched around the world in North America, Europe, Asia, and the southern hemisphere. They measure the temperature as they rise up to the stratosphere. So, we know what the temperature of the atmosphere has been from these really good balloon records. The warming observed from balloons is about a third of the warming that has been predicted by models.

Nobody knows how much of the warming observed over the past 50 years is due to CO2. There is good reason to that think much of it, perhaps most of it, would be there even without an increase in CO2 because we are coming out of the Little Ice Age. We have been coming out of that since the early 1800s, before which the weather was much colder than now.

The green curve (in the chart above) is measurements from satellites, very much like the measurements of a temporal scanning thermometer. You can look down from a satellite and measure the temperature of the atmosphere. The satellites and balloons agree with each other, and they do not agree with the computer models. This is very nice work by John Christie at the University of Alabama-Huntsville.

The alleged harm from CO2 is from warming, and the warming observed is much, much less than predictions. In fact, warming is almost certainly beneficial — it gives slightly longer growing seasons. You can ripen crops a little bit further north than you could before. But there is even better news (to increasing atmospheric CO2): by standards of geological history, plants have been living in a CO2 famine during our current geological period.

This is a picture of our best estimate of past levels of CO2:


The vertical scale, RCO2, is the amount of CO2 in the past that was greater than it is today.

You can see on that scale that over most of the past, CO2 levels have been five times, ten times. even twenty times greater than today. This period, approximately the past 540 million year since the Cambrian Period, is the Phanerozoic Eon, when we have good fossil records of life on Earth. So, we know pretty well what life was doing during that time from the sediments.

During all of this period, with much higher CO2 levels, life flourished on Earth. In general, it flourished better when there was more CO2. Plants really would prefer to have two, three, four times more CO2 than we have today, and you can see plants already responding to our currently increasing CO2 levels.

Let me show you an example:


This is the greening of the Earth measured from satellites.

This picture shows areas of the Earth that are getting greener over the 20-year period.

What you notice is that everywhere, especially in arid areas of Sahel (you can see that just south of the Sahara) it is greening dramatically. The western United States is greening, western Australia is greening, western India is greening. This is almost certainly due to CO2, and the reason this happens is that CO2 allows plants to grow where 50 years ago it was too dry.

Plants are now needing less water to grow than they did 50 or 100 years before.

Let me show you another example of what more CO2 does in terms of making plants grow better:


This is a picture of Dr. Sherwood Idso, and it was actually an experiment done here in Phoenix back in the 1980s.

This pine tree, I believe, is a Mediterranean variety, the Eldarica pine. On the left is a pine tree growing in the current CO2 level at that time, which was about 380 parts per million, and on the right are pine trees growing in higher and higher CO2 concentrations.

You can see that the more CO2 the pine trees have available, the faster they grow. You can do this with almost any plant: corn, wheat, cotton—they all grow better with more CO2.

This is the so-called pollutant that you hear about in connection with “the climate “emergency.”

So, let me explain the basics of why that works:


Take a low-power magnifying glass and you will see the leaf is full of little holes or “stomata.” The little holes are to let carbon dioxide diffuse from the air into the moist interior of the leaf, where the leaf, using the special enzyme called rubisco, (one of the most ancient enzymes in the world and the most abundant protein), combines CO2 with a water molecule, H2O, to make sugar.

The energy to run this little chemical factory within the leaf is provided by sunlight. The problem with this is the need for holes in the leaf. Not only do CO2 molecules diffuse in from the air, but H2O molecules diffuse out through the same hole and dry out the leaf. For every CO2 molecule that diffuses into the leaf there can be a hundred water molecules that diffuse out.

So, the plant has an engineering dilemma: it has to have holes in its leaf to get the CO2 that it needs to live. But those same holes desiccate it; they dry it out, and the plant needs water to live. But plants are not stupid. All over the world, they are growing leaves with fewer or smaller holes in them in response to increasing concentrations of atmospheric CO2. If there is more CO2 in the air outside, leaves do not need as many holes, and they do not leak as much water either. That is why you are seeing the greening of the earth. It is from the plants themselves taking advantage of CO2 coming back to more historically normal levels.

There is a second important issue.

The enzyme I mentioned, rubisco, is very ancient. It was probably invented, on the evolutionary scale, three and a half billion years ago. At that time, there was little oxygen in the air. So, rubisco was designed in a way that lets it be poisoned by oxygen. Plants today have a hard time when there is not enough CO2 in the air. When rubisco is charged with chemical energy to make sugar, but it cannot find a CO2 molecule, it grabs an oxygen molecule, O2, instead. It uses the oxygen to create hydrogen peroxide and other nasty oxidizing molecules.

One reason for the antioxidants in your tea is to mitigate this problem. This mistaken use of an O2 molecule rather than a CO2 molecule is called photorespiration. Suppression of photorespiration is one reason plants grow better with more CO2. There is a special type of plant called C4 plant, which includes American corn and sugar cane, that has partially solved this problem. But as the CO2 levels increase, the old-fashioned C3 plants, without all the biochemical machinery to cope with photorespiration, out-compete C4 plants.


When you raise all these hard, scientific issues with the climate alarmists, the response is “how can you say that? 97 percent of scientists agree that there’s a terrible emergency here that we have to cope with.”

Here there are several things you should say:

First of all, in science truth is not voted on. It is not like voting on a law. It is determined by how well your theory agrees with the observations and experiments. I just showed you that the theories of warming are grossly wrong. They are not even close and yet we are making our policy decisions based on computer models that do not work. It does not matter how many people say there is an emergency. If it does not agree with experiments and observations, the supposed scientific basis for the emergency is wrong. The claim of a climate emergency is definitely wrong.

Secondly, even when scientists agree, what they agree on can be wrong. People think of scientists as incorruptible, priestly people. They are not that at all. They have the same faults as everybody else, and they are frequently wrong.


----------------------------------------------------------------

Continued below
 
Last edited:

TxGal

Day by day
4th and final part:

A good example of that was the theory of “continental drift.”

When I was a student in the 1950s, nobody with any self-respect in geology admitted to believing in continental drift, although it had been proposed by Alfred Wegner, a German scientist in the 1920s and 1930s, and it was based on very good, hard evidence.

An example shown above is the fact that Africa, South America, India and Antarctica all fit together like a jigsaw puzzle. It is as though the jigsaw has been taken apart so that is pretty suggestive. Secondly, if you look at the fossils in these continents from 300 million years ago, 400 million years ago, they go smoothly from South America to Africa or from Africa to India or even into Antarctica. You find fossils of the same organisms even though there are thousands of kilometres of sea separating them today. That again suggests that these land masses were connected. Nevertheless, in spite of this quite persuasive evidence, Wegner was scorned and mocked all his life. He died falling into a crevasse in Greenland, exploring and looking for fossils. A sad ending.

The clincher actually came when the USA finally declassified the World War II North Atlantic Magnetic Anomaly data which we had been sitting on for 10 years. The data showed mirror-image conveyor belts of newly-formed oceanic crust, starting at the mid-Atlantic ridge and going out left and right toward America, and toward Europe. So, there was absolutely no question that the seafloor was spreading. That is the one bit of evidence that Wegner did not have, but he had lots of other evidence that should have persuaded people.

This is just one example. I could tell you about many other scientific consensuses that made no sense. This one is interesting because it had no political background. It was pure science, but it does illustrate the fallibility of scientists, and the group-think that goes on in science. If you wanted to advance as a young geologist you could write a paper scorning Wegner in 1950 and get promoted right away, even though your paper was completely wrong. And, once you get tenure, you are there for good.

So, the takeaway message is that policies that slow CO2 emissions are based on flawed computer models which exaggerate warming by factors of two or three, probably more. That is message number one. So, why do we give up our freedoms, why do we give up our automobiles, why do we give up a beefsteak because of this model that does not work?

Takeaway message number two is that if you really look into it, more CO2 actually benefits the world. So, why are we demonizing this beneficial molecule that is making plants grow better, that is giving us slightly less harsh winters, a slightly longer growing season? Why is that a pollutant? It is not a pollutant at all, and we should have the courage to do nothing about CO2 emissions. Nothing needs to be done.
 
Last edited:

TxGal

Day by day
Northern Hemisphere snow mass an historic 700 gigatons above average - Ice Age Now

Northern Hemisphere snow mass an historic 700 gigatons above average
May 5, 2021 by Robert

Northern-Hemisphere-Snow-Mass-19Apr21.jpg


Interesting how this can happen during a period of ‘global warming,’ isn’t it? You don’t suppose we’re being played do you?

Northern Hemisphere snow mass is an historic 700 gigatons above average. (A gigaton is one billion tons, so that means it’s an historic 700 billion tons above average.)

Image from the Finnish Meteorological Institute, date 19 April 2021.

https://i2.wp.com/electroverse.net/wp-content/uploads/2021/04/fmi_swe_tracker-38.jpg?ssl=1
Thanks to Oly for this link
 

northern watch

TB Fanatic
This bushfire season PROVES last year's 'global warming' narrative was fake news

Avi Yemini
May 6 2021
Rebel News

Australia's bushfire season has well and truly passed this year, but suddenly no one is talking about it.

If you recall, last year around this time, the lead story was "global warming set Australia on fire".

Last year we experienced one of the worst bushfire seasons in recorded history; the devastation was genuinely shocking. But like any natural disaster, climate change activists refused to let this grand opportunity pass without capitalising on it.

Don't get me wrong; I don't deny climate change exists.

Of course, the climate changes; it's been doing that forever. Take the old testament, for example; there's evidence of the "climate-changing" throughout it, from the extreme floods in Genisis to the severe droughts in the book of the Prophets.

My issue is the narrative that man-induced global warming caused last years bushfires without any actual scientific evidence, just a lot of theory.

But even more dishonest than that, neglecting the critical facts, namely:
  1. The fact that we were experiencing a natural phenomenon known as the Indian Ocean Dipole, which, if you remember, none of the climate change protesters I spoke to at the time even knew what it was.
  2. In addition to the natural phenomenon, we also had extreme fuel loads on the ground, which resulted from Green policies restricting the amount of prescribed burning and fire breaks allowed.
The truth is, in Australia, we have always experienced intense bushfires, drought and flooding. We always will. Reducing carbon emissions may help; it definitely won't stop the fires, droughts or floods.

The only thing scientifically proven is that managing the fuel load will stop bushfires from spreading so far and wide.

For example, take this year, no natural phenomenon plus all the fuel on the ground burnt away last year, and what do you know, a bushfire season that the media doesn't want to discuss.

If global warming was responsible for Australia burning last year, then by definition, we should be burning hotter this year.

This bushfire season PROVES last year's 'global warming' narrative was fake news (rebelnews.com)
 

jed turtle

a brother in the Lord
3rd part:

Schwarzschild was an officer in the German army in World War I, and he did some of his most creative work in the trenches on the eastern front facing Russia. He found one of the first analytic solutions to Einstein’s general theory of relativity while he was there on the front lines. Alas, he died before he got home. The cause of death was not Russian bullets but an autoimmune disease. This was a real tragedy for science. Schwarzschild was the theorist who first figured out how the real Earth, including the greenhouse gases in its atmosphere, radiates to space. That is described by the jagged black line.

The important point here is the red line.

This is what Earth would radiate to space if you were to double the CO2 concentration from today’s value. Right in the middle of these curves, you can see a gap in spectrum. The gap is caused by CO2 absorbing radiation that would otherwise cool the Earth. If you double the amount of CO2, you don’t double the size of that gap. You just go from the black curve to the red curve, and you can barely see the difference. The gap hardly changes.

The message I want you to understand, which practically no one really understands, is that doubling CO2 makes almost no difference. Doubling would replace the black curve by the red curve. On the basis of this, we are supposed to give up our liberties. We are supposed to give up the gasoline engines of our automobiles. We are supposed to accept dictatorial power by Bernie Sanders and Ocasio-Cortez, because of the difference between the red and the black curve. Do not let anyone convince you that that is a good bargain. It is a terrible bargain. The doubling actually does make a little difference. It decreases the radiation to space by about three watts per square meters. In comparison, the total radiation to space is about 300 watts per square meter. So, it is a one percent effect—it is actually a little less than that, because that is with no clouds. Clouds make everything even less threatening.

Finally, let me point out that there is a green curve. That is what happens if you take all the CO2 out of the atmosphere. No one knows how to do that, thank goodness, because plants would all die if you took all the CO2 out of the atmosphere. But what this curve is telling you is that the greenhouse effect of CO2 is already saturated. Saturation is a jargon term that means CO2 has done all the greenhouse warming it can easily do. Doubling CO2 does not make much difference. You could triple or quadruple CO2 concentrations, and it also would make little difference. The CO2 effects are strongly saturated.


You can take that tiny difference between those curves that I showed you, the red and the black curves, and calculate the warming that should happen. I was one of the first to do this: in 1982 I was a co-author of one of the first books on radiative effects of CO2. (Above) is my calculation and lots of other people’s calculations since. It is a bar graph of the warming per decade that people have calculated. The red bar is what has actually been observed. On the right is warming per decade over 10 years, and on the left, over 20 years. In both cases the takeaway message is that predicted warmings, which so many people are frantic about, are all grossly larger than the observed warming, which is shown by the red bars.

So, the observed warmings have been extremely small compared to computer calculations over any interval that you consider. Our policies are based on the models that you see here, models that do not work. I believe we know why they do not work, but no one is willing to admit it.


Here is another comparison of models and observations.

The red curve here on the bottom is the year. It starts in 1975. It goes through 2025 because model predictions are included. The top curve is predictions by the international climate-alarm establishment, and the bottom blue and green curves are observations.

The blue circles summarize temperatures measured with balloons. You probably know that every day thousands of balloons are launched around the world in North America, Europe, Asia, and the southern hemisphere. They measure the temperature as they rise up to the stratosphere. So, we know what the temperature of the atmosphere has been from these really good balloon records. The warming observed from balloons is about a third of the warming that has been predicted by models.

Nobody knows how much of the warming observed over the past 50 years is due to CO2. There is good reason to that think much of it, perhaps most of it, would be there even without an increase in CO2 because we are coming out of the Little Ice Age. We have been coming out of that since the early 1800s, before which the weather was much colder than now.

The green curve (in the chart above) is measurements from satellites, very much like the measurements of a temporal scanning thermometer. You can look down from a satellite and measure the temperature of the atmosphere. The satellites and balloons agree with each other, and they do not agree with the computer models. This is very nice work by John Christie at the University of Alabama-Huntsville.

The alleged harm from CO2 is from warming, and the warming observed is much, much less than predictions. In fact, warming is almost certainly beneficial — it gives slightly longer growing seasons. You can ripen crops a little bit further north than you could before. But there is even better news (to increasing atmospheric CO2): by standards of geological history, plants have been living in a CO2 famine during our current geological period.

This is a picture of our best estimate of past levels of CO2:


The vertical scale, RCO2, is the amount of CO2 in the past that was greater than it is today.

You can see on that scale that over most of the past, CO2 levels have been five times, ten times. even twenty times greater than today. This period, approximately the past 540 million year since the Cambrian Period, is the Phanerozoic Eon, when we have good fossil records of life on Earth. So, we know pretty well what life was doing during that time from the sediments.

During all of this period, with much higher CO2 levels, life flourished on Earth. In general, it flourished better when there was more CO2. Plants really would prefer to have two, three, four times more CO2 than we have today, and you can see plants already responding to our currently increasing CO2 levels.

Let me show you an example:


This is the greening of the Earth measured from satellites.

This picture shows areas of the Earth that are getting greener over the 20-year period.

What you notice is that everywhere, especially in arid areas of Sahel (you can see that just south of the Sahara) it is greening dramatically. The western United States is greening, western Australia is greening, western India is greening. This is almost certainly due to CO2, and the reason this happens is that CO2 allows plants to grow where 50 years ago it was too dry.

Plants are now needing less water to grow than they did 50 or 100 years before.

Let me show you another example of what more CO2 does in terms of making plants grow better:


This is a picture of Dr. Sherwood Idso, and it was actually an experiment done here in Phoenix back in the 1980s.

This pine tree, I believe, is a Mediterranean variety, the Eldarica pine. On the left is a pine tree growing in the current CO2 level at that time, which was about 380 parts per million, and on the right are pine trees growing in higher and higher CO2 concentrations.

You can see that the more CO2 the pine trees have available, the faster they grow. You can do this with almost any plant: corn, wheat, cotton—they all grow better with more CO2.

This is the so-called pollutant that you hear about in connection with “the climate “emergency.”

So, let me explain the basics of why that works:


Take a low-power magnifying glass and you will see the leaf is full of little holes or “stomata.” The little holes are to let carbon dioxide diffuse from the air into the moist interior of the leaf, where the leaf, using the special enzyme called rubisco, (one of the most ancient enzymes in the world and the most abundant protein), combines CO2 with a water molecule, H2O, to make sugar.

The energy to run this little chemical factory within the leaf is provided by sunlight. The problem with this is the need for holes in the leaf. Not only do CO2 molecules diffuse in from the air, but H2O molecules diffuse out through the same hole and dry out the leaf. For every CO2 molecule that diffuses into the leaf there can be a hundred water molecules that diffuse out.

So, the plant has an engineering dilemma: it has to have holes in its leaf to get the CO2 that it needs to live. But those same holes desiccate it; they dry it out, and the plant needs water to live. But plants are not stupid. All over the world, they are growing leaves with fewer or smaller holes in them in response to increasing concentrations of atmospheric CO2. If there is more CO2 in the air outside, leaves do not need as many holes, and they do not leak as much water either. That is why you are seeing the greening of the earth. It is from the plants themselves taking advantage of CO2 coming back to more historically normal levels.

There is a second important issue.

The enzyme I mentioned, rubisco, is very ancient. It was probably invented, on the evolutionary scale, three and a half billion years ago. At that time, there was little oxygen in the air. So, rubisco was designed in a way that lets it be poisoned by oxygen. Plants today have a hard time when there is not enough CO2 in the air. When rubisco is charged with chemical energy to make sugar, but it cannot find a CO2 molecule, it grabs an oxygen molecule, O2, instead. It uses the oxygen to create hydrogen peroxide and other nasty oxidizing molecules.

One reason for the antioxidants in your tea is to mitigate this problem. This mistaken use of an O2 molecule rather than a CO2 molecule is called photorespiration. Suppression of photorespiration is one reason plants grow better with more CO2. There is a special type of plant called C4 plant, which includes American corn and sugar cane, that has partially solved this problem. But as the CO2 levels increase, the old-fashioned C3 plants, without all the biochemical machinery to cope with photorespiration, out-compete C4 plants.


When you raise all these hard, scientific issues with the climate alarmists, the response is “how can you say that? 97 percent of scientists agree that there’s a terrible emergency here that we have to cope with.”

Here there are several things you should say:

First of all, in science truth is not voted on. It is not like voting on a law. It is determined by how well your theory agrees with the observations and experiments. I just showed you that the theories of warming are grossly wrong. They are not even close and yet we are making our policy decisions based on computer models that do not work. It does not matter how many people say there is an emergency. If it does not agree with experiments and observations, the supposed scientific basis for the emergency is wrong. The claim of a climate emergency is definitely wrong.

Secondly, even when scientists agree, what they agree on can be wrong. People think of scientists as incorruptible, priestly people. They are not that at all. They have the same faults as everybody else, and they are frequently wrong.


----------------------------------------------------------------

Continued below
That was a very important article! Thank you!
i sent a link to it to all my peeps (that I thought were capable of interest and understanding...). Most don’t care and the brainwashing has been complete, but at least “I” feel smarter and have a better comprehension of the deception that has been accomplished.
 
Last edited:

TxGal

Day by day
The Oppenheimer Ranch Project has a new podcast out:

Confirmed Tornadoes Touch Down From Virginia To Texas - More Snow Coming! - Space Junk Falling NOW! - YouTube

Confirmed Tornadoes Touch Down From Virginia To Texas - More Snow Coming! - Space Junk Falling NOW!
2,183 views • Premiered 7 hours ago

View: https://youtu.be/IWNqcxkRNbg
Run time is 29:29

Synopsis provided:

'I saw trees flying': More than 100M people from New Mexico to Delaware at risk of severe weather; at least 2 dead in Georgia https://bit.ly/3h5MhqI
2 radar-confirmed tornadoes touch down in Upstate, NWS says https://bit.ly/3tnmdd5
How a tornadic storm tore through West Virginia and parts of northern Maryland Monday https://wapo.st/3b7dCot
Watch Live: Here's what North Texas looks like the morning after severe weather rolled through https://www.youtube.com/watch?v=SjHNF...
Why have we had so much large hail this severe weather season? https://bit.ly/3hir64X
Unseasonably warm Thursday and snow by Saturday morning https://bit.ly/33kKkP6
Snowy, rainy spring leads to Denver’s wettest start to the year in over 70 years https://bit.ly/3h2pUSP
Another La Nina Winter? https://bit.ly/3vHTd1a
Thunderstorms in Florida and Central U.S.; Fire Weather Threats in North Plains https://www.weather.gov/
GFS Model Total Snow US https://bit.ly/3tn5Ehw GFS Model Temperature US https://bit.ly/3us86o7
GFS Model Total Snow Europe https://bit.ly/3eoASjU
THE UK SUFFERS ITS COLDEST MAY BANK HOLIDAY MONDAY ON RECORD WITH A LOW OF -5.9C https://bit.ly/3vLLqPQ
“ASTOUNDING” SNOW IN THE UK SET TO RIVAL 1979’S SNOWIEST MAY ON RECORD https://bit.ly/2Sk82IP
GERMANY’S COLDEST APRIL SINCE 1977 (SOLAR MINIMUM OF CYCLE 20) https://bit.ly/3enABhi
A Belgian farmer was annoyed by the stone in his tractor's path. He moved it and the French border https://cbsn.ws/3b5Zo7p
Cascadia Tremor Map https://bit.ly/3trQtDA
Iceland earthquakes during the last 48 hours https://bit.ly/3vNKaNe
Worldwide Volcano News http://bit.ly/2v9JJhO
and more
 

TxGal

Day by day
Parts of Ireland Report Coldest April since Records began (in 1943), as Iceland Registers Lowest May Temperature Ever - Electroverse


cold-ireland-e1620286731397.jpg

Extreme Weather GSM
PARTS OF IRELAND REPORT COLDEST APRIL SINCE RECORDS BEGAN (IN 1943), AS ICELAND REGISTERS LOWEST MAY TEMPERATURE EVER
MAY 6, 2021 CAP ALLON

According to Irish Meteorological Service’s monthly report (issued May 5, 2021), Ireland just suffered a historically cold month of April.

Dominating high-pressure systems set up to the west or northwest of Ireland, reads the report, which brought brutal polar air masses over the country, leading to below average temperatures.

The cold was intense.

Across the country, ALL weather stations logged a mean air temperatures that was either at or below their Long-Term Average (LTA) for the month; in fact, only one station matched their LTA–see Newport in the chart below:


Deviations from the norm ranged from -2.5C to 0C.

That lowest reading (-2.5C) was logged at Dublin Airport, which made for the airport’s coldest April mean temperature (5.6C/42F) since records began 78 years ago, in 1943 (solar minimum of cycle 17).

Ireland’s lowest daily temperature for the month was the -4.7C (23.5F), observed at both Dublin Airport and Casement Aerodrome during the weekend beginning April 10. These lows were 8.9C and 8.4C below the sites’ LTAs, respectively.

Also, ALL stations reported frost at some point during the month.

ICELAND REGISTERS LOWEST MAY TEMPERATURE EVER

According to preliminary data, a new Icelandic minimum temperature record for the month of May has been set.

On Tuesday, May 4, a bone-shattering -24.5C (-12.1F) was observed at Dyngjujökull glacier, which sits at elevation of 1,689 m (5,541 ft) above sea level, in the center of the island.

Dyngjujökull is an outlet glacier, part of the larger Vatnajökull glacier system.

Back in 2018, University of Iceland researchers found that ALL Icelandic glaciers were expanding — the first time the glaciers hadn’t shrunk year-on-year in a quarter of a century. The researchers were shocked by the discovery that all of Iceland’s glaciers, including Vatnajökull, had expanded during the previous last twelve months, from autumn to autumn, with many showing a really “significant addition of ice this year.”

“[This] is unusual over the last 25 years,” said project manager Finnur Pálsson at the time.

“It is a fact that it has been colder the last few years. And there was more snowfall in August on the upper part of Langjökull (pictured below), which is very unusual,” added Pálsson, who concluded that all this is no reason to doubt global warming–guess he had to crowbar that in.


Langjökull Glacier.

CLIMATE IS CYCLIC, NEVER LINEAR

If you’re bold enough to dump the AGW theory for a minute and bring solar activity into the mix instead, you’ll quickly solve the mystery of Iceland’s expanding glaciers.

Our star has just exited the Modern Maximum –a 40-or-so year period of historically high solar activity– and is now on the slide back down. The Solar Cycle just completed (24) was the weakest in more than 100 years, and as a result, planet Earth is once again cooling:


A sobering 2018 presentation by Professor Valentina Zharkova suggested that a new Grand Solar Minimum would begin in 2020. And true to her word, during the summer of last year, Dr. Zharkova published an editorial entitled “Modern Grand Solar Minimum will Lead to Terrestrial Cooling“ in which she provided evidence that the Modern (Eddy) Grand Solar Minimum had now begun.

The last time humans suffered a full-blown Grand Solar Minimum was the Maunder Minimum (1645-1715) when only two magnetic fields of the sun went out of phase. This time, Zharkova’s analysis shows that all four magnetic fields are going out of phase. Worth noting here is that Zharkova’s models run at a 93-97% success rate, and that she was one of only a small handful of scientists to correctly predict Solar Cycle 24 would be weaker than Cycle 23, out of 150+ models.


While I personally don’t think a full-blown GSM will commence until Solar Cycle 26 (so the early 2030s), it is every possibility that the history books will place its official start date at the beginning of SC25, as Zharkova suggests.

One thing is for sure though, the Modern Maximum is long-over, as is the warmth and predictable climate it delivered: welcome all, to the next Grand Solar Minimum and great cooling epoch.

The COLD TIMES are returning, the mid-latitudes are REFREEZING, in line with the great conjunction, historically low solar activity, cloud-nucleating Cosmic Rays, and a meridional jet stream flow (among other forcings).

Both NOAA and NASA appear to agree, if you read between the lines, with NOAA saying we’re entering a ‘full-blown’ Grand Solar Minimum in the late-2020s, and NASA seeing this upcoming solar cycle (25) as “the weakest of the past 200 years”, with the agency correlating previous solar shutdowns to prolonged periods of global cooling here.

Furthermore, we can’t ignore the slew of new scientific papers stating the immense impact The Beaufort Gyre could have on the Gulf Stream, and therefore the climate overall.


Prepare accordinglylearn the facts, relocate if need be, and grow your own.
 

TxGal

Day by day
United States: Severe Arctic Blast Inbound, Record-Annihilating Snowfall on the way for States such as Colorado - Electroverse

gfs_asnow_us_65-4-e1620299718136.png

Extreme Weather GSM
UNITED STATES: SEVERE ARCTIC BLAST INBOUND, RECORD-ANNIHILATING SNOWFALL ON THE WAY FOR STATES SUCH AS COLORADO
MAY 6, 2021 CAP ALLON

What’s on course to hit the U.S. starting this weekend looks BIG. It looks unprecedented. It looks as if it’s gonna rock the socks off even the staunchest of global cooling proponents, and hammer the final nail into the coffin of that poorly-aged global warming hypothesis…

Large swathes of the United States have already been suffering anomalous spring chills of late.

And those shivers are forecast to intensify as the month of May –yes, May– rolls on.

According to the latest GFS models (shown below), from May 6 through May 8, periodic pockets of out-of-season cold will bring temperature departures crashing down to some 8C to 16C below the seasonal average:


GFS 2m Temp Anomalies (C) May 6 through May 8 [tropicaltidbits.com].

But it’s on Sunday, May 9 that the real fun is forecast to begin.

A violent kink the jet stream looks set to deliver intense Arctic cold to the majority of the CONUS.

Here’s the GFS temperature anomaly chart for Sunday:


GFS 2m Temp Anomalies (C) for May 9 [tropicaltidbits.com].

An fierce band of polar cold is on course to streak west to east through the entire breadth of the U.S..

From Montana to Virginia, temperatures are scheduled to plunge as much as 20C below the seasonal norm.

And then as we push from May 10 to May 12, the rare mid-spring freeze sinks south to engulf states such as Texas, Oklahoma, New Mexico, Colorado, Kansas, Nebraska and Wyoming:

gfs_T2ma_us_fh114-138.gif

GFS 2m Temp Anomalies (C) May 10 to May 11 [tropicaltidbits.com].

Zooming in on the cold (below), May 13 is predicted to deliver an even harsher shot of polar cold to central and southern states, with departures from the norm threatening to head off the charts:

May-13-US-May.png

GFS 2m Temp Anomalies (C) for May 13 [tropicaltidbits.com].

And onto the big story:

Record-annihilating snowfall is expected to drop down from Canada beginning this weekend.

Beginning in Montana, Idaho, and Wyoming on Saturday, May 8, wintry storms are then predicted to have engulfed Colorado by Monday, May 10, where they’ll be counting totals in the feet across the state’s higher elevations:


GFS Total Snowfall (inches) May 6 to May 14 [tropicaltidbits.com].


GFS Total Snowfall (inches) May 6 to May 14 [tropicaltidbits.com].

Needless to say, these are unprecedented totals for May.

If the reality pans out anything like the models are forecasting, then May, 2021 will enter the books at the snowiest May on record across many U.S. states, with the highest one/two/three-day snowfall totals, too — there will be nothing in recorded history that comes even remotely close.

These are all signs of the times.

They are clear real-world indications that low solar activity —after a brief lag— is now having an impact on global temperatures. As recently reported, global temps dropped further below the 30-year baseline in April, continuing the sharp decline witnessed over the past 12-or-so months.

Low solar activity weakens the jet streams.

During times of reduced solar output the jet streams’ usual stable zonal (east to west) flow reverts to more of a wavy meridional one (north to south)…


…and depending on what side of the jet stream you’re on, (in the NH) this will either pull down frigid air from the Arctic, or drag up warmer air from the Tropics.

We’ve known these basic mechanisms for decades –as the the below article from 1975’s Science Mag would indicate– but as they clash with the modern politicized AGW agenda, they’ve conveniently been forgotten:


The overall trend during prolonged bouts of low solar activity is a decline in global temperatures (due to an influx in cloud-nucleating cosmic rays + an increase in volcanic eruptions–to name just two forcings), but intense bursts of heat are still always capable of occurring due to this arching jet stream, and this remains the case even within the depths of a full-blown ice age.

Reject the propaganda that is anthropgenic global warming.

Accept the truth proven each and every day by real-world observations.


The COLD TIMES are returning, the mid-latitudes are REFREEZING, in line with the great conjunction, historically low solar activity, cloud-nucleating Cosmic Rays, and a meridional jet stream flow (among other forcings).

Both NOAA and NASA appear to agree, if you read between the lines, with NOAA saying we’re entering a ‘full-blown’ Grand Solar Minimum in the late-2020s, and NASA seeing this upcoming solar cycle (25) as “the weakest of the past 200 years”, with the agency correlating previous solar shutdowns to prolonged periods of global cooling here.

Furthermore, we can’t ignore the slew of new scientific papers stating the immense impact The Beaufort Gyre could have on the Gulf Stream, and therefore the climate overall.


Prepare accordinglylearn the facts, relocate if need be, and grow your own.
 

TxGal

Day by day
We are in deep trouble - Ice Age Now

We are in deep trouble
May 6, 2021 by Robert

The following opinion piece by Ian K. is referring to my recent post about snow cover in the northern hemisphere being an historic 700 gigatons above average.
_________

We are in deep trouble
Ian K

The problem is this is not happening in the USA and there is very little interest in world news anymore.

When California and the southwestern desert region acts like a desert, the uninformed panic. Overwhelmed by images from cell phones, the general public sees every storm as a disaster which the media is quick to blame on global warming, which is undoubtedly caused by humans. Every tornado and hurricane is the worst that ever occurred. If permafrost melts and fossils are found, it is a sign of impending disaster. No thought whatsoever is given to the reality the fossils must have gotten there from an earlier period when when it was warmer. sic- it’s a cycle.

We are finding oil on moons far removed from the Earth, yet give no consideration to the origin of this oil. Was there a time when dinosaurs and giant ferns covered the moons of Saturn and Jupiter?

Maybe our own planet’s oil and gas has nothing to do with earlier life forms and is a near inexhaustible energy source we are trying to replace with far inferior and temporary wind and solar power. This process will produce new, unique and non-recyclable waste and toxic pollution, as they deteriorate, and destroy the countryside.

Drought conditions plague many areas used for food production and yet we take resources such as corn and use a gallon of fossil fuel to produce and deliver a gallon of ethanol which is inferior to gasoline in energy production and corrodes our engines. If and when the ice age comes ( and I am afraid it will be sooner than we think ) we will be sorry we did not produce stores of food for the famine which will surely follow close behind.

We have been conditioned to panic and live in fear ( just look at the disordered, confusing , and often contradictory response to Covid ), and then go along with government nonsense which allows us to be controlled.

We have stopped thinking logically because the education system is trying to limit non-conformist thought.

We are in deep trouble.
 

TxGal

Day by day
Record snowfall in Rochester, New York - Ice Age Now

Record snowfall in Rochester, New York
May 6, 2021 by Robert

21 April 2021 – “We set a record snowfall on the 21st as the airport picked up 2.8 inches of white stuff that day, surpassing the previous record of 1.5 inches set back in 1978,” says this article on spectrum local news.

“That wasn’t the only day in April with record-breaking precipitation. On April 11, a large storm system dropped over an inch of some much-needed rain. Prior to that, our entire area was classified as abnormally to moderately dry by the National Weather Service, as we were over three-quarters of inch below our average monthly rainfall to that point.

Meanwhile, rainfall on the 11th shattered the previous record set some 99 years ago.

“A rainfall total of 1.18 inches was measured at the airport on the 11th. Go back almost 100 years to find our previous record, which was 0.80 of an inch set back in 1922.”

April comes in above average in Rochester
Thanks to Clay Olson for this link
 

TxGal

Day by day
The Oppenheimer Ranch Project has a new podcast out:

Iceland Volcano Update: Lava Jets Surpass Incredible 400 m Height - Grímsvötn Volcano May Be Next - YouTube

Iceland Volcano Update: Lava Jets Surpass Incredible 400 m Height - Grímsvötn Volcano May Be Next
1,836 views • Premiered 3 hours ago

View: https://youtu.be/iKyk08prk08
Run time is 7:43

Synopsis provided:

Fagradalsfjall volcano update: Lava jets surpass incredible 400 m height https://bit.ly/3h3sjwI
Massive Lava Fountain from the Iceland Volcano (May 5, 2021) https://bit.ly/3ukPbeV
1600 FEET TALL HIGHEST LAVA FOUNTAINS RECORDED-Geldingadalir/Fagradalsfjall Eruption 5 May 2021 https://bit.ly/3f2z2UU
Live Feed #2! Iceland Volcanic Eruption https://bit.ly/2SiL19b
Reykjanes peninsula - earthquakes https://bit.ly/3rprWPn
Grímsvötn: Iceland’s most active volcano may be about to erupt https://bit.ly/3tvWeQU
The Aviation Color Code for Grímsvötn changed from green to yellow https://bit.ly/33nfZiW
Iceland Whole country - earthquakes https://bit.ly/3vNKaNe Grímsvötn Info
https://s.si.edu/3h5Rf6I
 

TxGal

Day by day
"Covert" NASA data reveals Global Snowfall has *Increased* Over the Past 40 Years - Electroverse

snowball_02.jpg

Articles
“COVERT” NASA DATA REVEALS GLOBAL SNOWFALL HAS *INCREASED* OVER THE PAST 40 YEARS
MAY 6, 2021 CAP ALLON

Experienced data analyst, 10-year Wall Street veteran, and self-proclaimed “Mrs. Smarty Pants,” Zoe Phin of phzoe.com crunches the data on GLOBAL SNOWFALL and reveals a surprising trend (surprising to the alarmists, at least).

Zoe was curious to know what the global snowfall trend was in this era of “extreme global warming.”

“Luckily,” she writes, “NASA covertly provides us with all the necessary data to figure this out.”

Zoe downloaded all available monthly images from 1980 to 2020 (inclusive), such as the one shown here:


Next, she converted the pixel colors back to data using the provided scale.

This is a clever way to extract a rich dataset, which isn’t available anywhere else: all other snowfall or snow-cover datasets are limited by region or date, and so researchers routinely reach the wrong conclusion!

The overall picture is what’s important.

Below are the results of Zoe’s quest:


Global Snowfall (1980-2020)
[0.2773 -> 0.2854 is +2.90%]

According to the “covert” NASA data, global snowfall has increased by nearly 3 percent over the last four decades. It went from 0.2773 to 0.2854 decigrams/m2/s, which is +2.90 percent more.

Zoe also goes on to break down the data by hemisphere.

If you were to only look at the Northern Hemisphere then you would be forgiven for concluding that Earth’s snowfall has been on the decline for the past 40 years (and this is routinely what agency’s like NASA do):


North Hemisphere Snowfall (Jan. 1980 through Dec. 2020–so less than halfway through the latest NH snow season)
[0.2722 -> 0.2468 is -9.35%]

But of course, our globe is, well, a globe — it has a Southern Hemisphere, too:


South Hemisphere Snowfall (again, Jan. 1980 through Dec. 2020).
[0.6257 -> 0.7057 is +12.77%]

Down south, snowfall has grown from 0.6257 to 0.7057 decigrams/m2/s, or a whopping +12.77%.

“This data is obviously available to NASA,” concludes Zoe (because that’s how the images are generated!).

“The truth is hard to find.

“But I try.”

For further examples of NASA’s data-tampering, obfuscating fraud, click the link below:


The COLD TIMES are returning, the mid-latitudes are REFREEZING, in line with the great conjunction, historically low solar activity, cloud-nucleating Cosmic Rays, and a meridional jet stream flow (among other forcings).

Both NOAA and NASA appear to agree, if you read between the lines, with NOAA saying we’re entering a ‘full-blown’ Grand Solar Minimum in the late-2020s, and NASA seeing this upcoming solar cycle (25) as “the weakest of the past 200 years”, with the agency correlating previous solar shutdowns to prolonged periods of global cooling here.

Furthermore, we can’t ignore the slew of new scientific papers stating the immense impact The Beaufort Gyre could have on the Gulf Stream, and therefore the climate overall.


Prepare accordinglylearn the facts, relocate if need be, and grow your own.
 

TxGal

Day by day
Coldest lows in Scottish Highlands since 1922 - Skiing in May - Ice Age Now

Coldest lows in Scottish Highlands since 1922 – Skiing in May
May 6, 2021 by Robert

Also, snowy start to May in northern Ireland.
_____________

Snow in May: Lake District skiers ‘giddy’ in unseasonal weather

Skiers in the Lake District have taken advantage of unseasonal snowfall to head to the slopes for the first time in months.
Snow which started on Tuesday was deep enough by Wednesday to allow the club’s tow up Raise, near Helvellyn, to run.
Members were “giddy” at the unusual sight of snow-covered mountains in May, club president Mike Sweeney said.
“I haven’t seen snow at this time of year before, but I was speaking to some other members who said there was snow in June in 1963, although that was a very unusual year for weather,” he said.

“It was fabulous, people were just giddy with excitement.”

“Up here we rely on drifts and have snow fences because we don’t get a great depth of snow, but some of the drifts today are as high as the fences,” said former club president and assistant hut warden Gerard Unthank, 80.
Walkers and climbers have also been enjoying the unusual conditions.

Bethany Smith said a hike up Helvellyn on Wednesday was her first since the end of the third lockdown.

“We knew it was white on the tops and I’m always prepared for all weather conditions, but we didn’t realise quite how deep the snow was until we got to Grisedale Tarn and noticed people descending from Fairfield Peak on their backsides,” she said.

“At some points, the snow drifts were up to our knees.”

“It felt more like we were in the Alps,” she said.

Frost has been unusually prevalent during April and May.

Snow in May: Lake District skiers 'giddy' in unseasonal weather

May snowfall brings disruption to Highlands

May snowfall has brought disruption to parts of Scotland, with the Highlands under a thick blanket of snow.

The Met Office issued a yellow “be aware” warning as the unseasonal weather affected travel on key routes in the area.
The southbound carriageway of the A9 at Daviot, south of Inverness, was blocked for a time by a fallen tree.

The A939 near Tomintoul in Moray was closed because a tanker was stuck in snow. Police said diversions would be in place while the road was closed.

Provisional data from the Met Office suggests it was the frostiest April for at least 60 years – with the lowest average minimum temperatures since 1922.

The frostiest place of all was Aboyne in Aberdeenshire, which dropped below freezing on 25 different nights.

May snowfall brings disruption to Highlands

Northern Ireland – Exceptional cold spell for early May

Snow was lying on the Glenshane Pass early on Wednesday and was clearly visible on the hills around Londonderry.

The heaviest showers could fall as sleet or snow throughout Wednesday on the highest parts of the Sperrin mountains or the Antrim hills.

That will especially be the case as temperatures fall, bring frost, on Wednesday night.

It is not a night to leave seedlings outdoors and in the coldest spots we could see temperatures drop as low as -4C
Such cold is certainly not an annual event, but it does happen from time to time.

A couple of listeners to the BBC’s Good Morning Ulster programme texted to say they had memories of snow in early May, including 1997 and 1981.

Snow in May: Lake District skiers 'giddy' in unseasonal weather

Thanks to Paul Cresswell for these links
 

TxGal

Day by day
Whistleblowers Accuse 22 Climate Papers of Fraud: "She Made Up Data" - Electroverse

IMG_0980-e1620371647516.jpg

Articles
WHISTLEBLOWERS ACCUSE 22 CLIMATE PAPERS OF FRAUD: “SHE MADE UP DATA”
MAY 7, 2021 CAP ALLON

A group of whistleblowers has asked three funding agencies for a misconduct investigation into a series of 22 research papers, many of them on the effects of ocean acidification on fish behavior and ecology.

The request rests on what they say is evidence of manipulation in publicly available raw data files for two papers.

The disputed papers’ main authors –Philip Munday (a marine ecologist) and Danielle Dixson (a U.S. biologist)– emphatically deny making up data, and James Cook University, Townsville, in Australia has dismissed the fabrication allegations against one of them after a preliminary investigation. But multiple independent scientists and data experts who reviewed the case flagged what they said were serious problems in the data sets.

Back in 2009, Munday and Dixson began to publish evidence that ocean acidification –a proposed knock-on effect of the rising carbon dioxide (CO2) level in Earth’s atmosphere– has a range of striking effects on fish behavior, such as making them bolder and steering them toward chemicals produced by their predators. As one journalist covering the research put it, “Ocean acidification can mess with a fish’s mind.” The pairs’ findings were even included in a 2014 report from the Intergovernmental Panel on Climate Change (IPCC), and ultimately have “profound consequences for marine diversity” and fisheries, warned Munday and Dixson.

But their work has since come under attack.

In January 2020, a group of seven scientists, led by fish physiologist Timothy Clark of Deakin University in Geelong, Australia, published a Nature paper reporting that in a massive, 3-year study, they didn’t see these dramatic effects of acidification on fish behavior at all.

The Seven went further still, accusing Munday and Dixson of “methodological or analytical weaknesses” which might have led to irreproducible results (aka fraud).


Many of the disputed studies were done at Lizard Island (far left), a marine biology mecca on the Great Barrier Reef.

The Seven are known for taking a strong interest in sloppy science and fraud — they had previously blown the whistle on a 2016 Science paper by another former Ph.D. student of Munday’s that was subsequently deemed fraudulent and retracted–and felt the Nature paper hinted at malfeasance.

In August 2020, Clark and three other members of the group took another, far bigger step: They asked three funders that together spent millions on Dixson’s and Munday’s work –the Australian Research Council (ARC), the U.S. National Science Foundation (NSF), and the U.S. National Institutes of Health (NIH)– to investigate possible fraud in 22 papers.

The request, which they shared with a Science reporter, rests on what they say is evidence of manipulation in publicly available raw data files for two papers, one published in Science, the other in Nature Climate Change, combined with remarkably large and “statistically impossible” effects from CO2 reported in many of the other papers. They also provided testimony from former members of the Dixson and Munday labs, some of whom monitored Dixson’s activities and concluded she made up data.


It is claimed that changes in fish behavior because of ocean acidification is a threat to coral reefs.

Munday retired from JCU in April of this year and has since emigrated to Tasmania, but emphasizes there is no connection between that timing and the allegations. Dixson denies making up data as well, “I fully stand by all the data I’ve collected, I stand by the papers that we’ve published,” she says, adding; “There hypothetically could be an error in there,” perhaps because of mistakes in transcribing the data; “I don’t know. I’m human.”

Multiple scientists and data experts unconnected to the Clark group who reviewed the case also flagged a host of problems in the two data sets, with one even finding serious irregularities in the data for additional papers co-authored by Munday.

This case isn’t just about data and the future of the oceans. It highlights issues in the sociology, psychology, and politics of science, including pressure on researchers to publish in top-tier journals, the journals’ thirst for eye-catching and alarming findings, and the risks involved in whistleblowing.

Members of the Clark group say they will soon publicize the alleged data problems on PubPeer, a website for discussion of published work.

For a more detailed look into the disputed research, click HERE.

 
Last edited:

TxGal

Day by day
Folks - this is not good at all:

England is on for its Coldest May since Record-Keeping Began back in 1659 (during the Maunder Minimum) - Electroverse

little-ice-age-e1620382223749.jpg

Extreme Weather GSM
ENGLAND IS ON FOR ITS COLDEST MAY SINCE RECORD-KEEPING BEGAN BACK IN 1659 (DURING THE MAUNDER MINIMUM)
MAY 7, 2021 CAP ALLON

Following its coldest APRIL since 1922, England is now on for its coldest MAY since record-keeping began some 362 years ago–since the Maunder Minimum (1645-1715)!

Back in 1659, England was still processing the death of Richard Cromwell, who, after the execution of King Charles I, had ruled the Commonwealth of England for 5 years. The year 1659 is also the start date of the Central England Temperature (CET) dataset, which has proved an invaluable resource for meteorologists and climate scientists alike. Astonishingly, what the dataset reveals in 2021, in this time of supposed “catastrophic global heating,” is that England is on for its coldest May in more than three and a half centuries (at least).

Even more astonishingly, note that 1659 falls within the early-stages of the Maunder Minimum (1645-1715)–a period of reduced global temperatures correlating with historically low solar activity during which the Sun was often devoid of sunspots for years and even decades at a time. Therefore, what the English are experiencing this May eclipses the extreme lows documented during the last full-blown Grand Solar Minimum.

“Snow in May,” reports the BBC.

“Lake District skiers ‘giddy’ in unseasonal weather,” continues the headline.

Snow started falling on Tuesday, May 4, and was deep enough by Wednesday to allow the Lake District Ski Club to open its slopes. Members were “giddy” at the unusual sight of snow-covered mountains in May, according to club president Mike Sweeney. “I haven’t seen snow at this time of year before,” he said.


“It was fabulous, people were just giddy with excitement,” said ski club president Sweeney.

These May flurries have been substantial, too, rivaling what the area would receive in the depths of winter.

Former president of the club Gerard Unthank said there had been “quite a bit of snow this year. Up here we rely on drifts and have snow fences because we don’t get a great depth of snow, but some of the drifts today are as high as the fences,” he said.


Skiing in May, in England.

“At some points, the snow drifts were up to our knees,” said Bethany Smith during a hike up Helvellyn:


Bethany Smith hiking in the Lake District in May, 2021.

The UK snow has not only been substantial, but also widespread, particularly across the north.

This was the wintry scene in Morlich, Scotland on May 6:

View: https://twitter.com/UKsnow_updates/status/1390189195956731907
Run time is 0:26

Additionally, as well as this being its coldest May ever, this also looks set to be the UK’s snowiest May on record–a feat currently held by the May of 1979 (solar minimum of weak cycle 20):


Depressingly, there have been few ‘dots connected’ in the UK press.

BBC Weather presenter Simon King did admit that snow was not common in May, but also said that it was “not out of the question”–whatever the hell that means.

The furthest the broadcaster went was to admit that “frost has been unusually prevalent during April and May.”

The UK Met Office are just as bad as the BBC.

And while they are at least reporting on the historic conditions (see below), there is a reluctance to draw any connections to the climate; when you just know, if the situation were reversed –i.e. England was currently experiencing a record May heatwave– then “climate change” would be all anyone was banging on about.

View: https://twitter.com/metoffice/status/1390441563151536128
Run time is 0:12

A low of -5.5C (22.1F) was reported during the past 24 hours, in Eskdalemuir — a reading that rivals the coldest temperature ever recorded for the date: the -5.6C (21.9F) set back on May 6, 1980.

But of course, this is all just “weather.”

Heatwaves are an indication of climate change, but record Arctic outbreaks –even those in the month of May– are merely expected statistical anomalies that require no further action than a hasty sweeping under the rug: they are “not out of the question,” after all, and unprecedented freezes –that have dragged on for almost two months now (having begun in mid-March)– are barely considered newsworthy.

Furthermore, these frigid conditions are impacting more tha just the UK.

The majority of the Europe is suffering, as is much of the Northern Hemisphere as a whole.

Below was the scene in the Netherlands this morning, May 7:

View: https://twitter.com/PJLvanUden/status/1390529578276360194
Run time is 0:11

While across the pond, in the North America, unprecedented late-season cold and snow is inbound there, too:


This is exactly what those that study the Sun warned will happen, with many on record stating it would begin in earnest in 2021.

Spring is springing historically late across much of the Northern Hemisphere this year, which is the main cause for concern. Global cooling shortens the growing seasons, and our modern mono-cropping ways that were developed during a constant and reliable climate (delivered by the Modern Solar Maximum) are now beginning to fail, which is placing hundreds of millions of people at the risk of starvation.

Returning to the data, England’s May CET, which is compiled by the UK Met Office Hadley Centre, reveals that the month’s mean temperature, to May 7, is running at just 7C (44.6F) — this is a jaw-dropping 2.8C below the CET norm, and currently sees England on course to suffer its coldest May since record-keeping began back in 1659.

Moreover, the current top-spot holder is held by the May of 1698, with its CET of 8.5C (47.3F) — this means that the May of 2021 is not only breaking that all-time 362-year record, it is smashing it, by a full 1.5C (2.7F)!

Latest forecasts are calling for much of the same as the month progresses, with yet more unseasonable snow:


GFS Total Snowfall (inches) May 7 – May 14 [tropicaltidbits.com].

The COLD TIMES are returning, the mid-latitudes are REFREEZING, in line with the great conjunction, historically low solar activity, cloud-nucleating Cosmic Rays, and a meridional jet stream flow (among other forcings).

Both NOAA and NASA appear to agree, if you read between the lines, with NOAA saying we’re entering a ‘full-blown’ Grand Solar Minimum in the late-2020s, and NASA seeing this upcoming solar cycle (25) as “the weakest of the past 200 years”, with the agency correlating previous solar shutdowns to prolonged periods of global cooling here.

Furthermore, we can’t ignore the slew of new scientific papers stating the immense impact The Beaufort Gyre could have on the Gulf Stream, and therefore the climate overall.


Prepare accordinglylearn the facts, relocate if need be, and grow your own.
 

TxGal

Day by day
Guess it's really happening, isn't it? Not that I've had many doubts for the last few years. It's just the only thing that explains so many things, including for me, the increasingly poor performance of my gardens.

Yes, I really believe it is, too. Like you, our gardens just haven't been doing well at all the last few years in particular, and I've been gardening since I was a kid. Something is just off, and I'm not convinced it's just the temps, I think the sunlight is just....different. I think we've talked about that before.

We had that really bizarre week in Feb this year when our temps stayed below freezing for a solid week. Definitely not our normal, and we're seeing the damage everywhere we look. Lots of dead trees, pecans, oaks (especially live oaks), ornamentals...and many of them native species. We're harvesting wild dewberries right now, and we're getting just fractions of what we'd normally get. Not enough to do anything with except give them to the chickens, really.

I'm not sure, but I'm 'pretty' sure that some pastures were affected, also. We're lucky, I guess, that our pastures are a wide variety of grasses (and some weeds), because I don't think our coastal is looking at all good this year. Fortunately we downsized our herd for 'retirement' and we just have lawn mowers on the hoof, so to speak, and enough graze for them until a drought hits. That would be our normal. What isn't normal is coastal bermuda looking sparse...I think it comes from southeast Africa originally, before it was imported for grazing in the southern states. I'm really glad we didn't try to knock out other grasses as some ranchers do in favor of only coastal.

We've almost given up on our garden again this year. We're doing a little 'reorganizing' and will probably put in a few things, maybe just the potatoes, cukes, and watermelons. Mostly I'm thinking of the fall garden and how that will (or won't) work out. Produce in the stores hasn't been wonderful. Cantaloupes were crazy expensive and dreadful, and red potatoes are running 99 cents a lb, when we should be seeing half that price. And they haven't looked great, either. Watermelons have been mushy or flavorless, for the most part.

I'm actually more concerned about having enough firewood (in Texas!!) and propane (we're good now, I think) for the upcoming heating season. We've got a lot of downed trees and limbs to get cut for winter.

I have a bad feeling about the upcoming winter....kind of one of those 'something wicked this way comes' kind of feelings.
 

TxGal

Day by day
Years of Failed Arctic Sea Ice Predictions - Electroverse

mpv-everest-e1620389477659.jpg

Articles
YEARS OF FAILED ARCTIC SEA ICE PREDICTIONS
MAY 7, 2021 CAP ALLON

Over the past few decades, geographers, oceanographers, geophysicists, glaciologists, climatologists, geoengineers, and Al Gore –ha– have shown great interest in Arctic Ocean sea ice extent.

Many of these experts envisaged an ice-free Arctic Ocean.

Needless to say, each and every one of these forecasts has been proven hopelessly wrong, yet most of the scientists behind them have retained their positions and credibility within their respective fields.

This is an indication of how deep the narrative runs.


PROF. WIESLAW MASLOWSKI

‘Scientists in the US have presented one of the most dramatic forecasts yet for the disappearance of Arctic sea ice,’ reported the BBC back in 2007. ‘Their latest modelling indicates that northern polar waters could be ice-free in summers within just 5-6 years.’

Professor Wieslaw Maslowski from the Department of Oceanography of the US Navy predicted an ice-free Arctic Ocean by the summer of 2013.

Maslowski added that his prediction was on the conservative side, too: “Our projection of 2013 for the removal of ice in summer is not accounting for the last two minima, in 2005 and 2007. So given that fact, you can argue that may be our projection of 2013 is already too conservative.”

The BBC boasted that Maslowski used ‘supercomputers to crunch through possible future outcomes.’

The broadcaster also used the below image in their article, I assume in an attempt to evoke an emotional response:


NASA’S JAY ZWALLY

Also back in 2007, we had NASA climate scientist Jay Zwally’s prediction: “The Arctic Ocean could be nearly ice-free at the end of summer by 2012, much faster than previous predictions.”

Zwally was quoted in many publications at the time: “The Arctic is often cited as the canary in the coal mine for climate warming. Now as a sign of climate warming, the canary has died. It is time to start getting out of the coal mines,” he said.

PROF. DAVID BARBER

In 2008, University of Manitoba professor David Barber prophesied: “We’re actually projecting this year that the North Pole may be free of ice for the first time [in history]. This is a very dramatic change in the High Arctic climate system.”

British AGW rag The Independent ran the ‘Exclusive’ story: ‘It seems unthinkable, but for the first time in human history, ice is on course to disappear entirely from the North Pole this year,’ reads the opening paragraph, which is all you get to see unless you pay… which I didn’t.

In reality, the 2008 summer minimum turned out to have more ice than in 2007.

NSIDC DIRECTOR MARK SEREEZER

In 2010, Mark Sereezer, the newly appointed senior scientist at the US government’s Snow and Ice Data Center (NSIDC) in Boulder, Colo. was famously quoted as saying: “the Arctic is screaming.”

Geographer Serreze, who now holds the job as NSIDC director, warned that global warming will render the Arctic ice free by the summer of 2030 — a claim picked up by the likes of the telegraph.co.uk, but one that shows no indications of materializing.

Below was the state of Arctic Sea Ice volume during the 2020 minimum.

Data from the Danish Meteorological Institute (DMI) reveal levels were within the average range:


[DMI].

PROF. PETER WADHAMS

In 2012, head of the Polar Ocean Physics Group at the University of Cambridge (UK), Professor Peter Wadhams, foretold of a complete collapse of the Arctic ice sheet by 2015-2016 — predictably leapt on by theguardian.com.

‘As sea ice shrinks to record lows, Prof Peter Wadhams warns a ‘global disaster’ is now unfolding in northern latitudes,’ reads the article’s subheading.

‘One of the world’s leading ice experts has predicted the final collapse of Arctic sea ice in summer months within four years,’ continued the piece. ‘In what he calls a “global disaster” now unfolding in northern latitudes as the sea area that freezes and melts each year shrinks to its lowest extent ever recorded, Prof Peter Wadhams of Cambridge University calls for “urgent” consideration of new ideas to reduce global temperatures: “Climate change is no longer something we can aim to do something about in a few decades time, and we must not only urgently reduce CO2 emissions but must urgently examine other ways of slowing global warming, such as the various geoengineering ideas that have been put forward.”‘

Once again though, real-world observations ended-up leaving a modern climate researcher with egg on their face, because far from reaching the forecast record lows, the year 2016 actually saw the quickest Arctic refreeze ever recorded, with the sea ice extent advancing 405,000 m2 (1.05 million km2) in just three weeks.

The DMI actually noted that that rate of refreezing was the fastest since its daily records began in 1987.

That contradicting reality didn’t stop Professor Wadhams cashing in on his scaremongering, however. His book “A Farewell To Ice,” in which he again repeated the assertion that the polar region would ice-free within just a few years, was published in 2016 to the predictably-blind critical acclaim of AGW propaganda rags such as The Guardian.

There are hundreds-more dire Sea Ice predictions that have either expired or are soon to expire, but the mainstream media is yet to offer a single retraction; in fact, many of the failures are still up online, for all to see.

Let us not forget that overstuffed doormat of a man Al Gore in all this:


This is the danger when politics, and the funding it brings, drives science, instead of the age-old standards of ideas, logic, testing, and real-world observations.

The above list of fails is a sad indictment of modern science, yet the researches involved have all retained their positions and credibility — how? Because Global Warming is a powerful political tool. It will prop you up and support you if you follow the rules, but it will tear you down the minute you dare to question it.


AGW is being used as propaganda to enforce literally whatever those string-pulling elites deem fit.

And unfortunately, the masses are too distracted, far too busy slaving away at 9-5’s (in order to keep their heads above water–ironically), to stop and observe these now decades-worth of scientific discrepancies.

The catastrophe is always “X” amount of years away, and when that “X”-date does uneventfully come and go, the doomsday deadline quietly gets pushed on, to scam the next generation.

AOC says we now have 10 years left to avert the end of the world.

I wonder what new power-hungry know-nothing know-it-all politician we’ll be hearing from in 2031, when AOC’s prediction also uneventfully passes us by. Although by then, a far more likely climatic reality will be upon us: global cooling, as decades of low solar activity would by then of had a cumulative impact on terrestrial temperatures:


The COLD TIMES are returning, the mid-latitudes are REFREEZING, in line with the great conjunction, historically low solar activity, cloud-nucleating Cosmic Rays, and a meridional jet stream flow (among other forcings).

Both NOAA and NASA appear to agree, if you read between the lines, with NOAA saying we’re entering a ‘full-blown’ Grand Solar Minimum in the late-2020s, and NASA seeing this upcoming solar cycle (25) as “the weakest of the past 200 years”, with the agency correlating previous solar shutdowns to prolonged periods of global cooling here.

Furthermore, we can’t ignore the slew of new scientific papers stating the immense impact The Beaufort Gyre could have on the Gulf Stream, and therefore the climate overall.


Prepare accordinglylearn the facts, relocate if need be, and grow your own.
 

TxGal

Day by day
Severe Arctic Cold Headed for Continental U.S. - And Record-Breaking Snowfall - Ice Age Now

Severe Arctic Cold Headed for Continental U.S. – And Record-Breaking Snowfall
May 7, 2021 by Robert

Intense-Arctic-Cold-for-CONUS-May-9-2021.png

“What’s on course to hit the U.S. starting this weekend looks BIG,” says electroverse.net. “It looks unprecedented.”


According to the latest GFS models (above) from May 6 through May 8, periodic pockets of out-of-season cold will bring temperature departures crashing down to some 8C to 16C below the seasonal average.

But it’s on Sunday, May 9 that the real problems are forecast to begin.

A violent kink the jet stream looks set to deliver intense Arctic cold to the majority of the CONUS.

The image at top of this page shows the GFS temperature anomaly chart for Sunday, because that’s when a fierce band of polar cold is on course to streak west to east through the entire breadth of the U.S.

From Montana to Virginia, temperatures are scheduled to plunge as much as 20C below the seasonal norm.

Then, from May 10 to May 12 (image below), a rare mid-spring freeze sinks south to engulf Texas, Oklahoma, New Mexico, Colorado, Kansas, Nebraska and Wyoming.

Rare-mid-spring-freeze-11-May-2021.png


“May 13 is predicted to deliver an even harsher shot of polar cold to central and southern states, with huge departures from the norm.”

Along with the cold, record-annihilating snowfall is expected to drop down from Canada.

“Beginning in Montana, Idaho, and Wyoming on Saturday, May 8, wintry storms are predicted to have engulfed Colorado by Monday, May 10, where they’ll be counting totals in the feet across the state’s higher elevations.”

“Needless to say, these are unprecedented totals for May,”.

“If the reality pans out anything like the models are forecasting, then May, 2021 will enter the books at the snowiest May on record across many U.S. states with the highest one/two/three-day snowfall totals.” If so, “there will be nothing in recorded history that comes even remotely close.”

According to the National Weather Service,

“Unsettled weather is expected across the Northern Rockies and Northern Plains through Sunday.”

“Over the next couple of days, an upper-level trough/low is forecast to move eastward into the western U.S. and push a frontal system across the West ahead of it. These features will lead to precipitation for the Northern Rockies into the Northern Plains. Several inches of snow is expected in higher elevations, and some light snow amounts could even spread into lower elevations of the Northern Plains, given cooler than average temperatures spreading into the northwestern and north-central U.S. after a warm Friday across the Rockies.”

“Broad upper-level troughing over the eastern part of the U.S. will lead to below normal temperatures there, especially in terms of highs–highs in the 50s and 60s for the Midwest to the Northeast and Mid-Atlantic would be 10 to 20 degrees below normal through the weekend. On Saturday, much colder air filters into the north-central U.S. with the trough approaching.”

WPC's Short Range Public Discussion

See more as to why we’re entering a full-blown solar minimum:
United States: Severe Arctic Blast Inbound, Record-Annihilating Snowfall on the way for States such as Colorado - Electroverse

Thanks to Winston Smith for these links
 

TxGal

Day by day
Hawaii - Heavy snow at the summits through Friday night - Ice Age Now

Hawaii – Heavy snow at the summits through Friday night
May 7, 2021 by Robert

“Want more trouble?” asks reader. (In response to “We are in deep trouble.” Snow expected in Hawaii.

National Weather Service Honolulu HI
May 6 2021

WINTER STORM WATCH FOR BIG ISLAND SUMMITS ABOVE 12000 FEET…
Deep tropical moisture lifting northward into the area combined with freezing temperatures and increasing instability associated with an upper low could lead to periods of heavy snow at the summits tonight through Friday night. Conditions should begin to improve over the weekend.

Big Island Summits-
322 AM HST Thu May 6 2021

WINTER STORM WATCH IN EFFECT FROM THIS EVENING THROUGH LATE FRIDAY NIGHT…

* WHAT…Heavy snow possible. Total snow accumulations of 6 inches or more are possible.

* WHERE…Big Island Summits above 12000 feet.

* WHEN…From this evening through late Friday night.

* IMPACTS…Heavier bursts of snow could be accompanied by gusty winds, low visibility in clouds, and cloud to ground lightning.

Honolulu, HI

Thanks to Kenneth Lund for this link
 

TxGal

Day by day
Volcano news: reports and updates on volcanic activity woldwide / 1-7 May, 2021 / VolcanoDiscovery

Worldwide Volcano News and Updates:

latest (May 2021) | Apr 2021 | Mar 2021 | archive

Volcanic activity worldwide 7 May 2021: Fuego volcano, Popocatépetl, Reventador, Mayon, Sangay, Sin...
Fri, 7 May 2021, 21:00


Map of today's active volcanoes

Suwanose-jima (Ryukyu Islands): (7 May) Volcanic Ash Advisory Center Tokyo (VAAC) issued the following report: ERUPTED AT 20210507/0638Z FL060 EXTD E OBS VA DTG:07/0630Z Read more... read all

Volcanoes Today, 7 May 2021: Fuego volcano, Popocatépetl, Reventador, Mayon, Sangay, Sinabung, Sabancaya, Suwanose-jima
Fri, 7 May 2021, 17:00

Sinabung Volcano Volcanic Ash Advisory: DISCRETE VA EMISSION TO FL180 MOV NNW OBS VA DTG: 07/1600Z to 18000 ft (5500 m)
Fri, 7 May 2021, 16:00
Sangay Volcano Volcanic Ash Advisory: CONS VA CLD EMS. to 21000 ft (6400 m)
Fri, 7 May 2021, 15:30
Popocatépetl Volcano Volcanic Ash Advisory: CONS VA EMS. to 19000 ft (5800 m)
Fri, 7 May 2021, 13:45
Reventador Volcano Volcanic Ash Advisory: INTMT VA CLD EMS. to 15000 ft (4600 m)
Fri, 7 May 2021, 12:45
Sabancaya Volcano Volcanic Ash Advisory: SPORADIC EMISSIONS to 24000 ft (7300 m)
Fri, 7 May 2021, 11:15
Mayon volcano (Luzon, Philippines) activity update: faint crater glow, continuous ground deformation
Fri, 7 May 2021, 09:30

The volcano remains at light volcanic unrest, with faint glow from the crater visible at night and continuing ground deformation detected by instruments of the Philippine Institute of Volcanology and Seismology (PHIVOLCS). Read more... read all
Sinabung Volcano Volcanic Ash Advisory: VA TO FL180 MOV NORTHEAST OBS VA DTG: 07/0845Z to 18000 ft (5500 m)
Fri, 7 May 2021, 08:45
Sinabung volcano (Northern Sumatra, Indonesia): high activity continues
Fri, 7 May 2021, 07:59


Strong explosion from Sinabung volcano this morning (image: @Rizal06691023/twitter)

The volcano continues at high levels and remains very active over the last week. Read more... read all
 

TxGal

Day by day
Ice Age Farmer has a new podcast out about supply chain issues (not 100% GSM-related, but we're already seeing issues with the supply chain, crops, etc., and folks are having problems with their gardens due to odd weather conditions, so this is important):

BRACE FOR IMPACT: "About to get much worse." - YouTube

BRACE FOR IMPACT: "About to get much worse."
20,914 views • Premiered 6 hours ago

View: https://youtu.be/0fQ0vYvlI20
Run time is 45:24

Synopsis provided:

We are staring down the barrel of a confluence of several scenarios--each of which individually is a significant, life-changing event--but which are together conspiring is a dangerous and incendiary situation: food shortages, inflation, and a breakdown of the supply chain. A new media narrative today acknowledges food shortages, and blames animal agriculture, indicating we are reaching an inflection point in the collapse. Expect things to accelerate from here. Let's have a conversation tonight about where we are, where we're heading, and how to prepare.

Intro: (0:00)
Shipping: (4:50)
Inflation: (8:56)
Grains Shortage (13:07)
Meat Shortages (21:56)
Now you must eat GMO (23:41)
*HUGE* Narrative Shift! (26:24)
SOLUTIONS (33:08)
 

TxGal

Day by day
The Oppenheimer Ranch Project has a new podcast out:

Snowfall Total Increases - Global Warming Fraud etc... 22 Papers Are Fraud LOL! - Sinabung BOOM! - YouTube

Snowfall Total Increases - Global Warming Fraud etc... 22 Papers Are Fraud LOL! - Sinabung BOOM!
2,627 views • Premiered 7 hours ago

View: https://youtu.be/sfhQoJuX7sQ
Run time is 11:26

Synopsis provided:

Ping pong hail, half-mile visibility - severe spring storms hit Colorado https://bit.ly/3esfz0J
20-plus inches of snow could hit parts of Colorado, according to report https://bit.ly/3nYZ0Nb
GFS Model Total Snow US https://bit.ly/3xY8KM8
GFS Model Total Snow Europe https://bit.ly/332e83w
ENGLAND IS ON FOR ITS COLDEST MAY SINCE RECORD-KEEPING BEGAN BACK IN 1659 (DURING THE MAUNDER MINIMUM) https://bit.ly/3uwFRVt
Heavy snow blankets parts of UK in -6C freeze before heatwave sweeps country in severe weather https://bit.ly/3haIDM1
WHISTLEBLOWERS ACCUSE 22 CLIMATE PAPERS OF FRAUD: “SHE MADE UP DATA” https://bit.ly/2SBDK4D
“COVERT” NASA DATA REVEALS GLOBAL SNOWFALL HAS *INCREASED* OVER THE PAST 40 YEARS https://bit.ly/3uuFsmv
Sinabung volcano (Northern Sumatra, Indonesia): high activity continues https://bit.ly/3vMCJ87
An M-Class solar flare reaching near the M4 level (M3.9) was just detected around AR 2822 in the northeast quadrant. The event was associated with Type II and IV radio emissions, a sign that a potential CME is possible. https://www.solarham.net/
Active Regions Visible Today 1 SESC Sunspot Number 15 https://bit.ly/3vRLptW
ISWA Signet Streamer https://go.nasa.gov/2R8QL1h
The Very Latest SOHO Images https://go.nasa.gov/3uywBzW
and more
 

TxGal

Day by day
The Dutch report Thundersnow, as German Cities record their First May Snowfall in Half a Century - Electroverse

Sutch-May-snow-e1620456040860.jpg

Extreme Weather GSM
THE DUTCH REPORT THUNDERSNOW, AS GERMAN CITIES RECORD THEIR FIRST MAY SNOWFALL IN HALF A CENTURY
MAY 8, 2021 CAP ALLON

Summer is just around the corner, yet it’s snowing ACROSS Europe.

It snowed in the Dutch province of Brabant yesterday, May 7.

In fact, heavy thundersnow was reported: “A unique combination in May,” reads a recent weer.nl article.

Holland’s cold spell, which has been going on for almost two months now, has been severe.

The nation as a whole just suffered its coldest April since 1986 (solar minimum of cycle 21) — average temps finished some 3.2C below the climatological norm of 9.9C.

April’s historic chill also delivered a total of 10 snow days, which made for the most snow recorded in the Netherlands in April since 1977 (solar minimum of cycle 20).

And the snow has continued into May, too — an incredibly rare phenomenon.

View: https://twitter.com/PJLvanUden/status/1390529578276360194
Run time is 0:11

“It’s May 7 … and it is snowing! What’s going on?” exclaimed one Brabant local on social media.

Another tweeted: “Welcome to May 7! Considerable snow just in the east of Brabant…”

View: https://twitter.com/StormchaserNL/status/1390548355466596353
Run time is 0:09

The snow settled on the ground, “which is very rare nowadays in the third spring month,” continues weer.nl.

“People can’t believe their eyes.”

View: https://twitter.com/samemmers2001/status/1390567132384092162

GERMAN CITIES LOG THEIR FIRST MAY SNOWFALL SINCE THE 1960S

With an average temperature of just 6C (42.8F), April 2021 was Germany’s coldest April since that of 1977 (solar minimum of cycle 20). The country’s average reading finished a whopping 3C below the 1991-2020 climatological norm, and even 2.3C below the previously-used 1981-2010 baseline.

And now in May, as is the case in many other European nations, the cold is lingering.

According to reports, rare May snow is hitting regions such as Potsdam — the cities’ first May flakes since 1969.

Snowfall is also being observed in Berlin — and after a quick ERA5 analysis, it is revealed that in the past 70 years, May snow has only fallen in the German capital on three occasions: in 1991, in 1978, and back in 1970.

View: https://twitter.com/theberlinexpert/status/1390704778443898884
Run time is 0:17

Looking ahead, today, May 8, looks set to be another cold one across Europe.

But then, by Sunday, May 9, a narrow corridor of central Europe, which includes France, the Netherlands, Belgium and Germany, will find themselves on the other side of a weak and wavy “meridional” jet stream setup, meaning anomalous heat will be pulled up from Africa:


GFS 2m Temp Anomalies for May 9 [tropicaltidbits.com].

This is yet another example of the ‘Swings Between Extremes’ we can expect during times of historically low solar activity, such as we’re experiencing now (see link below). Parts of Holland, for example, are set to flip from freezing conditions and snow on Saturday, to highs of 23C (73.4F) by Monday.


This central European warmth could prove very short-lived, however, as another switch could be on the cards.

By Tuesday, May 11, these same regions look set to be above the jet stream again, meaning they’ll be exposed to another shot of polar air being pulled down from the Arctic.

The cold then looks set to intensify even further over following few days.

Below are the GFS runs for Wednesday, May 12 and Thursday, May 13:


GFS 2m Temp Anomalies for May 14 [tropicaltidbits.com].


GFS 2m Temp Anomalies for May 13 [tropicaltidbits.com].

Such meridional jet stream flows are tricky to forecast, so only time will tell how the above models do.

Look (below) at the “mess” that is the current setup high-above the North Hemisphere.

Count the troughs/ridges around the extratropics — Doc V on Twitter makes it eight:

View: https://twitter.com/MJVentrice/status/1390722691997523972

And finally, eyeing even further ahead –and admittedly into the even more unreliable time-frame– just look what’s currently in store for the majority of Europe around the third week of May, particularly eastern regions:


GFS 2m Temp Anomalies May 18 – May 21 [tropicaltidbits.com].

Stay tuned for updates.

The COLD TIMES are returning, the mid-latitudes are REFREEZING, in line with the great conjunction, historically low solar activity, cloud-nucleating Cosmic Rays, and a meridional jet stream flow (among other forcings).

Both NOAA and NASA appear to agree, if you read between the lines, with NOAA saying we’re entering a ‘full-blown’ Grand Solar Minimum in the late-2020s, and NASA seeing this upcoming solar cycle (25) as “the weakest of the past 200 years”, with the agency correlating previous solar shutdowns to prolonged periods of global cooling here.

Furthermore, we can’t ignore the slew of new scientific papers stating the immense impact The Beaufort Gyre could have on the Gulf Stream, and therefore the climate overall.


Prepare accordinglylearn the facts, relocate if need be, and grow your own.
 

TxGal

Day by day
The Oppenheimer Ranch Project has a new podcast out:

Wave of Snow Returns Across The USA - Rocket Body Falls To Earth Near The Maldives - Iceland LIVE - YouTube

Wave of Snow Returns Across The USA - Rocket Body Falls To Earth Near The Maldives - Iceland LIVE
3,382 views • Premiered 6 hours ago

View: https://youtu.be/ue7eZ8IpI1w
Run time is 22:14

Synopsis provided:

Wave of snow to return wintry conditions to Rockies https://bit.ly/3uATH96
Spring Storm to Bring Snow to Colorado https://bit.ly/3hb4IKD
Widespread Rain Expected, With Snow in Chicago Area on Mother's Day https://bit.ly/3bfZBVM
More than halfway through spring, snow covers Montana prairies https://bit.ly/3eu6uoo
Rare Mother's Day snow possible from Illinois through Pennsylvania https://cbsn.ws/33qYyh8
Huge hailstone that fell in Texas could be one for the record books https://bit.ly/3xWrwUm
GFS Model Total Snow US https://bit.ly/3bcDShw
GFS Model Total Snow Europe https://bit.ly/332e83w
THE DUTCH REPORT THUNDERSNOW, AS GERMAN CITIES RECORD THEIR FIRST MAY SNOWFALL IN HALF A CENTURY https://bit.ly/2Q0V5Tw
UAH Global Temp https://bit.ly/3tFmDMd
YEARS OF FAILED ARCTIC SEA ICE PREDICTIONS https://bit.ly/33wPyag
Mount Sinabung’s recent volcanic eruption https://bit.ly/3uCu0oM
Worldwide Volcano News http://bit.ly/2v9JJhO
Live Feed #2! Iceland Volcanic Eruption https://bit.ly/2SiL19b
Space Weather News https://spaceweathernews.com/
Visible Sunspot Summary for May 8, 2021 https://www.solarham.net/regions.htm
Fruit Walls: Urban Farming in the 1600s https://bit.ly/3esxrZA
Evidence of Active Volcanoes on Mars https://bit.ly/3bg0hKO
China now reporting https://weibo.com/2196038737/KeDPliFXS that the rocket reentered at 0224 UTC at 72.47E 2.65N which is right over the Maldives. If correct will be interesting to see if we get reports from there https://bit.ly/3evQDWr
US East Coast sky will glow green SATURDAY due to NASA's suborbital sounding rocket releasing a vapor some 200 miles above the surface to study space plasma https://bit.ly/3hci21b
and more
 

TxGal

Day by day
Prof. Fritz Vahrenholt: Solar-Induced Cooling *this Decade* is our only hope against Dangerous CO2-Reducing Policies - Electroverse


cooling-world.jpg

Articles
PROF. FRITZ VAHRENHOLT: SOLAR-INDUCED COOLING *THIS DECADE* IS OUR ONLY HOPE AGAINST DANGEROUS CO2-REDUCING POLICIES
MAY 9, 2021 CAP ALLON

Prof. Fritz Vahrenholt holds a doctorate in chemistry.

He began his professional career at the Federal Environmental Agency in Berlin before joining the Hessian Ministry of the Environment. From 1984 until 1990 he served as state secretary for environment, from 1991 till 1997 as minister for energy and environment in the state of Hamburg.
He is also the author of several environmental books; the bestseller “Seveso ist überall” (“Seveso is everywhere”) was one of the most influential books for the green environmental movement in Germany.

In 2012, Vahrenholt together with geologist Sebastian Lüning published Die kalte Sonne: warum die Klimakatastrophe nicht stattfindet (The Cold Sun: Why the Climate Crisis Isn’t Happening), a book asserting that climate change is driven by variations in solar activity. The pair predict the Earth is entering a cooling phase due to periodic solar cycles. Other contributors to the book include Nir Shaviv, Werner Weber, Henrik Svensmark and Nicola Scafetta.

Prof. Vahrenholt provides a monthly summary of the climate on his website kaltesonne.de.
Below are a few exerts and paraphrasings from May 2021’s edition:

The deviation of the global mean temperature of the satellite-based measurements from the average for the years 1991-2020 decreased further to -0.05 degrees Celsius in April 2021:


[Dr Roy Spencer]

The recent La Nina is still having a cooling impact. NOAA says there is an 80% chance that La Nina will end between May and July; however, the agency is expecting a new one to start again in the fall.

Latest real-world observations (one dataset shown below) reveal that the climate models –on which the recommendations of the IPCC are based– are coming out twice as warm as the reality, on average:


[click HERE for the source]

This blatant deviation from the real temperature development is politically significant because the prognoses of the models are used as the basis for far-reaching decisions, such as constitutional court judgments.

A recent German court hearing found on the fundamentals of climate change:

“ There is an approximately linear relationship between the total amount of greenhouse gases emitted and the increase in mean surface temperature ” (Section 19). ” Without additional measures to combat climate change, a global temperature increase of more than 3 ° C by the year 2100 is currently considered likely “.

But here, continues Vahrenholt, the court ignores the considerable uncertainties about feedback effects, such as clouds. In describing the “actual principles of climate change” and the “actual principles of climate protection,” the court refers to just four sources, with the IPCC being the main one.

So-called tipping point processes in the climate system are seen as a particular danger to ecological stability, because they can have far-reaching environmental effects. Tilting elements are parts of the earth system that are of particular importance for the global climate and that change abruptly and often irreversibly as the load increases. Examples are the permafrost soils in Siberia and North America, the ice masses in the polar zones, the Amazon rainforest and significant air and ocean current systems.

The judges had obviously not read the FAZ interview with Jochem Marotzke from the Max Planck Institute in Hamburg: When asked by FAZ, “Which tipping point worries you most?” Marotske replied, “None.”

And then, when it came to ‘extreme weather events,’ the court again failed to deal in facts, claiming:


The increase in drought and drought observed in Germany is considered a particular challenge. The associated drying out of the soil is particularly important for agriculture…”


Even the German Meteorological Service had declared in 2018 –as the IPCC did in 2013– that it was difficult to statistically prove an increase in extreme weather events — this also applies to worldwide droughts, heavy rain events, hurricanes and tornadoes.

To refute the court’s claim, Vahrenholt provides a graphic depicting summer rainfall in Germany:


[Source]

The summer rain in Germany is subject to strong fluctuations, but there is no long-term trend. The amount of precipitation in summer has not changed statistically significantly over the past 135 years (source).

And while the summer data comfortably refutes the court’s assumptions, the winter rainfall data tears it apart:


[Source]

Overall, annual precipitation in Germany has increased by 10 percent over the past 135 years (source).

Furthermore, there is also no increase in drought across Europe, writes Vahrenholt, or even worldwide.

Yet, here we have paragraph 28 of the court’s resolution, stating:

Climate change is also an important cause of flight and migration. People also leave their homes as a result of natural disasters and due to long-term environmental changes such as increased droughts and the rise in sea levels.”

But as Benjamin Schraven, of the German Development Institute writes:

“There are many indications that the still widespread assumption of an automatism between climate change and migration must be strongly questioned. Such a general ecodeterminism is empirically untenable.”

The court’s following insufficient understanding of sources had huge consequences on its verdict:

It is assumed that there is an approximately linear relationship between the total amount of anthropogenic CO2 emissions accumulated over time and the global temperature increase. Only small parts of the anthropogenic emissions are absorbed by the oceans and the terrestrial biosphere “.

This is objectively wrong, stresses Vahrenholt.

But the court’s baseless assumptions went on:

Most of the rest of anthropogenic CO2 emissions remain in the atmosphere over the long term, add up, contribute to increasing the CO2 concentration and thus have an effect on the temperature of the earth. In contrast to other greenhouse gases, CO2 no longer leaves the earth’s atmosphere naturally in a period of time that is relevant to humanity. Every additional amount of CO2 that enters the earth’s atmosphere and is not artificially removed from it (below marginal 33) thus permanently increases the CO2 concentration and leads accordingly to a further rise in temperature. This rise in temperature will persist even if the greenhouse gas concentration does not increase any further.

But even the IPCC would contradict this: It is stated that about 4.7 ppm are currently being added to the atmosphere annually by anthropogenic CO2 emissions, but more than half of the increase is taken up by the oceans and plants (where the court says, “only small parts”!?). Since the uptake of plants and oceans is proportional to the CO2 concentration in the atmosphere, a significant reduction in emissions –such as halving– would clearly have a reduction in the concentration in the atmosphere in the future.

But this court hearing in Germany, as is the case with many others around the world, isn’t about scientific inquiry, meaning it is futile trying to combat it as such. “Results” are being funded, not the scientific endeavor. Today, science is being used as a front, a tool in order to achieve whatever measures the ‘global system’ deems fit. As an indication of this, with its recent finding, the court was now able to create the prerequisites for the CO2 budget approach:

Therefore, it is possible to approximate the maximum amount of further CO2 that is allowed to enter the earth’s atmosphere permanently so that this target earth temperature is not exceeded … This amount is referred to as the “CO2 budget” in the climate policy and climate science discussion.”

And this is what it’s all about.

The court then begins to calculate the budget:

If one takes 6.7 gigatons as a concrete national remaining CO2 budget from 2020, as determined by the Council of Economic Experts for the goal of limiting the increase in the mean earth temperature to 1.75 ° C with a probability of 67%, this would mean the remaining budget has already been largely consumed by the CO2 quantities permitted by 2030.

Indeed, Germany’s Climate Protection Act stipulates a reduction in CO2 emissions from 0.813 GT in 2020 to 0.543 GT in 2030 for all sectors of Germany from energy to industry, buildings, transport and agriculture.

The court adds up the limited emissions, and comes to the result:

After 2030, less than 1 gigaton of the remaining CO2 budget of 6.7 gigatons determined by the Advisory Council would remain. In order to maintain the budget limits, climate neutrality would have to be achieved soon after 2030.”
The court itself admits itself that this as a big ask:

In order to strictly maintain the emissions framework specified by Art. 20a of the Basic Law, reduction efforts would then be necessary from today’s point of view to an unreasonable extent, especially since the general way of life is likely to be characterized by high CO2 intensity in 2031 … the constitutional climate protection requirement … (would) require the acceptance of considerable restrictions on freedom.”

Basically, unless Germany shuts down soon after 2030, the limited emissions plan will fail and, in the court’s eyes at least, heat and extreme drought will be left unchecked, and catastrophe will strike. Here, the court is arriving at the same extreme view of a plaintiff, Prof. Quaschnin, who had called for zero CO2 emissions by 2035.

The court provides for an average remaining budget of just 0.05 GT per year for 2030 to 2050, which is as much as the building materials industry alone currently emits — again, judges have taken the current state of discussion of the climate debate, which is fraught with high uncertainty, as an opportunity to set the CO2 budget in Germany to zero.

A bewildered Vahrenholt concludes: If the Climate Protection Act was already capable of causing considerable loss of prosperity and jobs in 2030, the tightening that is now to be expected will lead to deep distortions.

Wind and solar will not provide the necessary energy. And in any case, this is about the shutdown of gas and oil heating, the ban on gasoline and diesel cars, the shutdown of truck traffic, air traffic, and refineries. Late, very late, it will be recognized that the electrification of the heating, transport and industry sectors without gas, without the CO2 capture that is prohibited in Germany, without the nuclear energy that is prohibited in Germany, cannot be achieved. The green program — that will fail grandly.

However, Vahrenholt remains confident in his predictions of a cooling planet, and sees this upcoming solar-induced reduction in terrestrial temperatures as our only hope against such poverty-inducing policies.

But, of course, global cooling will deliver immense suffering all of its own.

‘Rock and a hard place’ comes to mind.

A total economic collapse is looming, one way or another — prepare now.

The COLD TIMES are returning, the mid-latitudes are REFREEZING, in line with the great conjunction, historically low solar activity, cloud-nucleating Cosmic Rays, and a meridional jet stream flow (among other forcings).

Both NOAA and NASA appear to agree, if you read between the lines, with NOAA saying we’re entering a ‘full-blown’ Grand Solar Minimum in the late-2020s, and NASA seeing this upcoming solar cycle (25) as “the weakest of the past 200 years”, with the agency correlating previous solar shutdowns to prolonged periods of global cooling here.

Furthermore, we can’t ignore the slew of new scientific papers stating the immense impact The Beaufort Gyre could have on the Gulf Stream, and therefore the climate overall.


Prepare accordinglylearn the facts, relocate if need be, and grow your own.
 

TxGal

Day by day
I'm bringing over an article from Patrice Lewis and her blog Rural Revolution. She's writing about the weather whiplash, temps changing dramatically over a very short span of time. We've had it a few times of late and I think it's about to happen again in our area. It can just wreck havoc with gardens finally getting started. Challenging gardening times, to be sure:

Rural Revolution: Weather whiplash, Part II (rural-revolution.com)

Saturday, May 8, 2021
Weather whiplash, Part II

If you remember, a couple days ago we were expecting some weather whiplash in the form of dramatic temperature swings between Thursday and Friday.


I was marveling at the prediction of a thirty-five degree variance between one day and the next. Well as it turns out, the predictions were off. We had a forty-six degree variance between Thursday and Friday.
Thursday was a sizzling 93F at our place.


By afternoon, we suspended all outdoor work.


Songbirds were lifting their wings and opening their beaks to cool off.


Mr. Darcy stayed flat on his side as much as possible, trying to keep cool.


Clouds moved in by evening and it grew very humid.


Then the thermometer plummeted overnight and we woke up to rain and cool temperatures. The day never warmed up beyond 47F.


Yep, weather whiplash. Not that we mind the cooler temperatures; 93F was just too warm for early May.
 

Martinhouse

Deceased
TxGal, where is this Patrice Lewis located? I keep hearing that there's going to be this big cold spell hitting soon, but my ten-day forecast isn't showing anything but pretty much normal for this time of year. That in itself kind of surprises me, but can it be true when all around me it's being said a big cold snap is coming?
 

John Deere Girl

Veteran Member
TxGal, where is this Patrice Lewis located? I keep hearing that there's going to be this big cold spell hitting soon, but my ten-day forecast isn't showing anything but pretty much normal for this time of year. That in itself kind of surprises me, but can it be true when all around me it's being said a big cold snap is coming?
She lives in Idaho.
 

John Deere Girl

Veteran Member
We have been under a freeze/frost advisory since Friday evening and will be until Wednesday. We saw snowflakes yesterday, and Accuweather is warning of more today. This is not normal May weather. I have all our strawberries, rhubarb, cabbage, and broccoli plants covered, but there's not much I can do for our vineyards, fruit trees, and berry bushes.
 

TxGal

Day by day
TxGal, where is this Patrice Lewis located? I keep hearing that there's going to be this big cold spell hitting soon, but my ten-day forecast isn't showing anything but pretty much normal for this time of year. That in itself kind of surprises me, but can it be true when all around me it's being said a big cold snap is coming?

Martinhouse, sorry, we went out grocery shopping shortly after I posted that. Thanks, John Deere Girl, for answering her question!

Yep, Patrice is way up north, so I'd expect her weather to be colder than ours down here. My take on her posting was that the wide temp swings are a bit different from what they're used to up there.

We have a cold front coming in later today that could produce nasty storms, and then our night temps dip into the low 50s for a few days. Not a drastic change, just the kinda usual seesawing we all seem to get in one form or another. Now if it's a more drastic drop in temps, or longer duration, than that would be a surprise. Hoping not, I'm getting a little tired of all this severe weather and extra large hail...even though it's spring and not all that unusual...much.
 
Last edited:

TxGal

Day by day
Winter Storm Watch for Parts of Colorado and Wyoming - Ice Age Now

Winter Storm Watch for Parts of Colorado and Wyoming
May 9, 2021 by Robert

That’s winter, as in WINTER, on May 9 – 8 to 14 inches of snow possible – Also, May snow on the Great Plains of the Dakotas and New Hampshire’s Mount Washington.

URGENT – WINTER WEATHER MESSAGE
National Weather Service Denver CO
Sun May 9 2021

…WINTER STORM WATCH FROM MONDAY AFTERNOON THROUGH TUESDAY MORNING…

* WHAT…Heavy snow possible. Total snow accumulations of 8 to 14 inches possible.

* WHERE…Rocky Mountain National Park and the Medicine Bow Range, The Mountains of Summit County, the Mosquito Range, and the Indian Peaks, The Northern Front Range Foothills, and The Southern Front Range Foothills.

* WHEN…From Monday afternoon through Tuesday morning.

* IMPACTS…Travel could be very difficult. The hazardous conditions could impact the Monday evening and Tuesday morning commutes.

Including the cities of Winter Park, Westcreek, Rocky Mountain National Park, Central City, Red Feather Lakes, Breckenridge, Bailey, Williams Fork Mountains, Evergreen, Georgetown, Glendevey, Indian Peaks, Nederland, Eisenhower Tunnel, East Slopes Southern Gore Range, Mount Evans, Cameron Pass, East Slopes Mosquito Range, Berthoud Pass, Kenosha Mountains, Estes Park, Willow Creek Pass, Laramie and Medicine Bow Mountains, Idaho Springs, and Rabbit Ears Range

South and East Jackson/Larimer/North and Northeast Grand/Northwest Boulder Counties Above 9000 Ft-South and Southeast Grand/West Central and Southwest Boulder/Gilpin/Clear Creek/Summit/North and West Park Counties Above 9000 Ft-Larimer and Boulder Counties Between 6000 and 9000 Ft-Jefferson and West Douglas Counties Above 6000 Feet/Gilpin/Clear Creek/Northeast Park Counties Below 9000 Ft

National Weather Service Watch Warning Advisory Summary

“Still expecting snow in Mt Washington, New Hampshire Tue/Wed with below freezing temps as well as some snow for areas of the Adirondacks above 3,000 ft thru Tuesday, with a mixture of rain/snow in parts of the Midwest Sunday,” says reader Kenneth Lund. “Temps could drop below freezing overnight over parts of Nebraska thru West Virginia and north thru New England, depending on elevation, thru early next week. Certainly cold for May!”

“May snow on the Great Plains of the Dakotas today,” says reader Ryan. “That’s a sign of the global warming they are so certain about, isn’t it?”
 

TxGal

Day by day
More than halfway through spring, snow covers Montana prairies -- Earth Changes -- Sott.net

More than halfway through spring, snow covers Montana prairies

USA Today
Sat, 08 May 2021 12:19 UTC

snow

Throughout Montana on May 8, people said hello to winter weather again as snow blanketed the landscape.

Video at website - Run time 0:31

View: https://youtu.be/xKRLEVWbaLU
Run time is 0:55
 
Last edited:
Top